
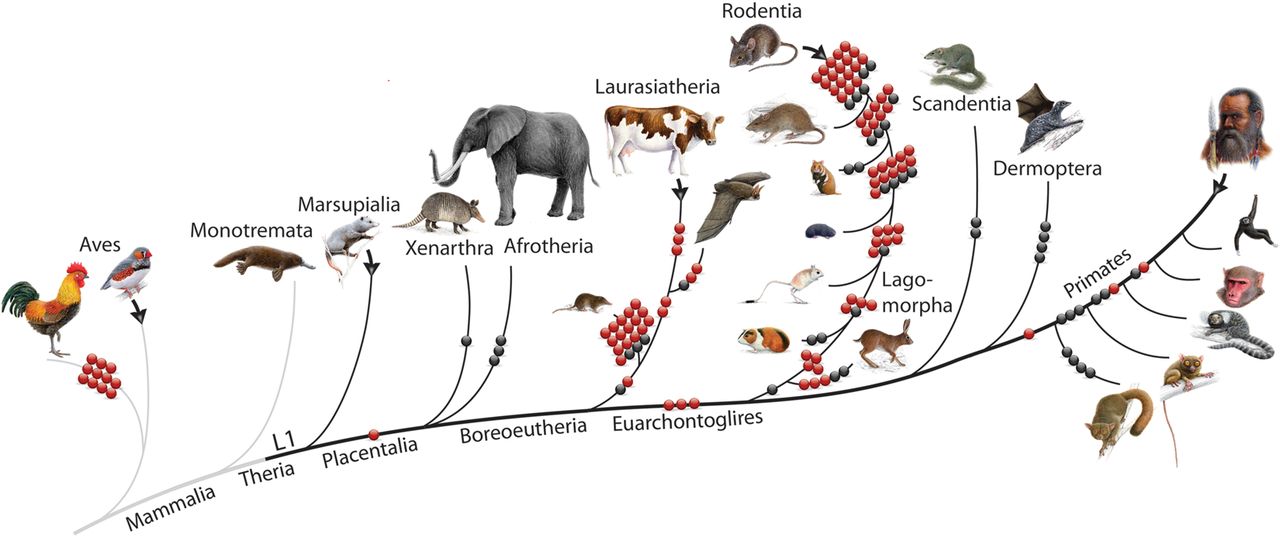
Figure 2.
2-n-way detected intron losses in representative mammals and birds. Red and black dots represent lost introns detected by 2-n-way. Red dots show introns whose loss was detected only once in evolution. Black dots represent the phylogenetic distribution of multiple intron losses in mammals. Black branches cohere with the activity of LINE-1 (L1) elements. Black arrows indicate the search directions starting in n-way from the coordinates for introns that are present and screening for intron loss in other lineages. The dog is not shown but was used to find intron losses in different taxa.


