
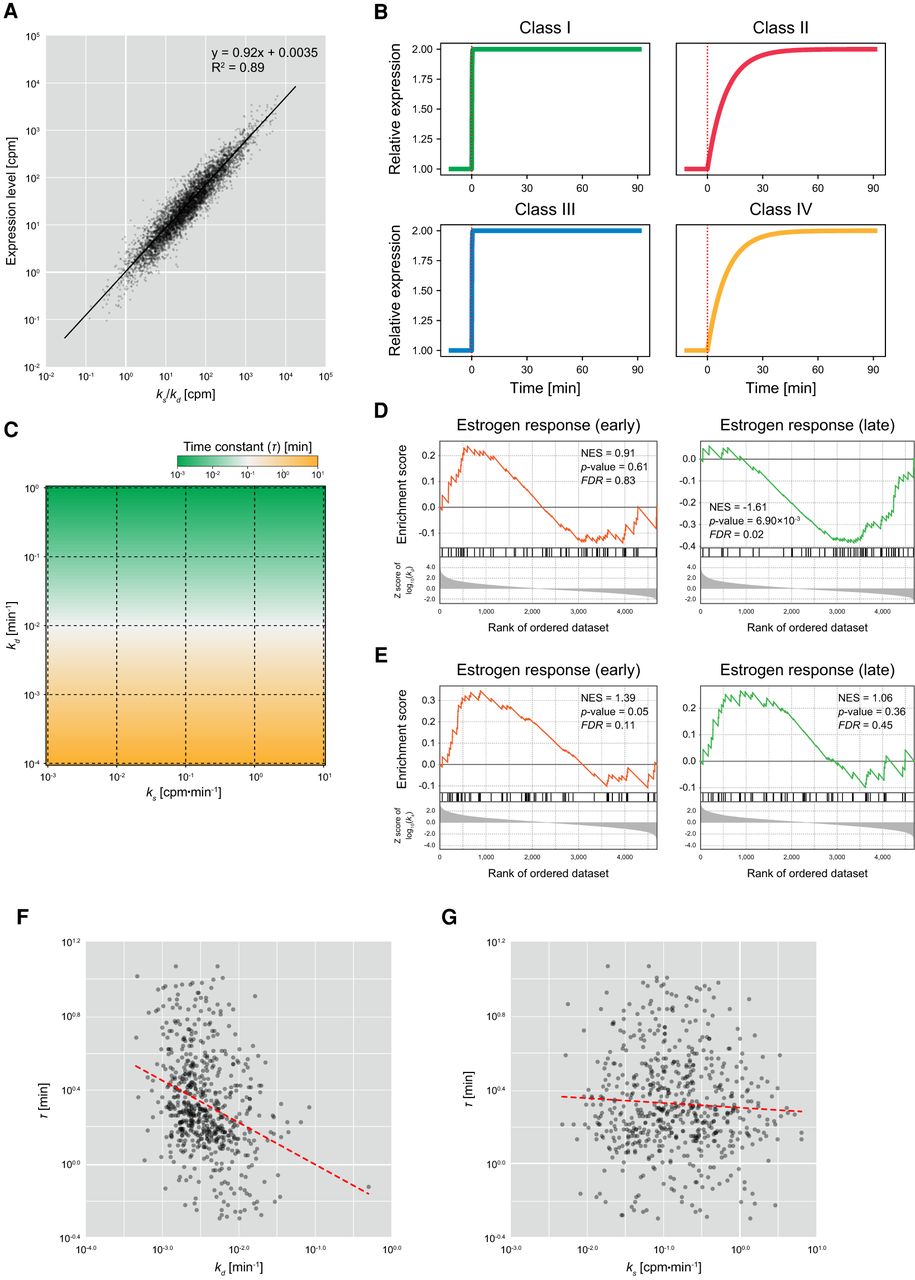
Effect of RNA synthesis and degradation rates on behavior of gene expression. (A) Comparison of ratios of RNA synthesis and degradation rates, with expression levels. The x- and y-axes indicate the ratio of RNA synthesis and degradation rates (ks/kd) and the expression level calculated based on the sequencing of Alkyl-RNAs (total RNA-seq reads with/without T > C conversion), respectively. Black solid line is the regression line based on log-transformed values. (B) Simulations of expression time series of genes imitating the characteristics of Class I (fast RNA synthesis and fast degradation), Class II (fast RNA synthesis and slow degradation), Class III (slow RNA synthesis and fast degradation), and Class IV (slow RNA synthesis and slow degradation). In each simulation, the RNA synthesis rates doubled at 0 min (red dotted line). (C) Time constants of expression of genes showing various RNA synthesis and degradation rates. The x- and y-axes indicate RNA synthesis rate (ks) and degradation rate (kd). Colors indicate the time constants (τ). (D,E) GSEA of degradation rate (D) and RNA synthesis rate (E) showing enrichment of “estrogen response (early)” and “estrogen response (late).” (NES) Normalized enrichment score. (F) Comparison of degradation rates (kd) and time constants (τ). The x- and y-axes indicate the degradation rate and time constants, respectively. Red dashed line is a regression line based on log-transformed values. (G) Comparison of RNA synthesis rates (ks) and time constants (τ). The x- and y-axes indicate the RNA synthesis rate and time constants, respectively. Red dashed line is a regression line based on log-transformed values.


