
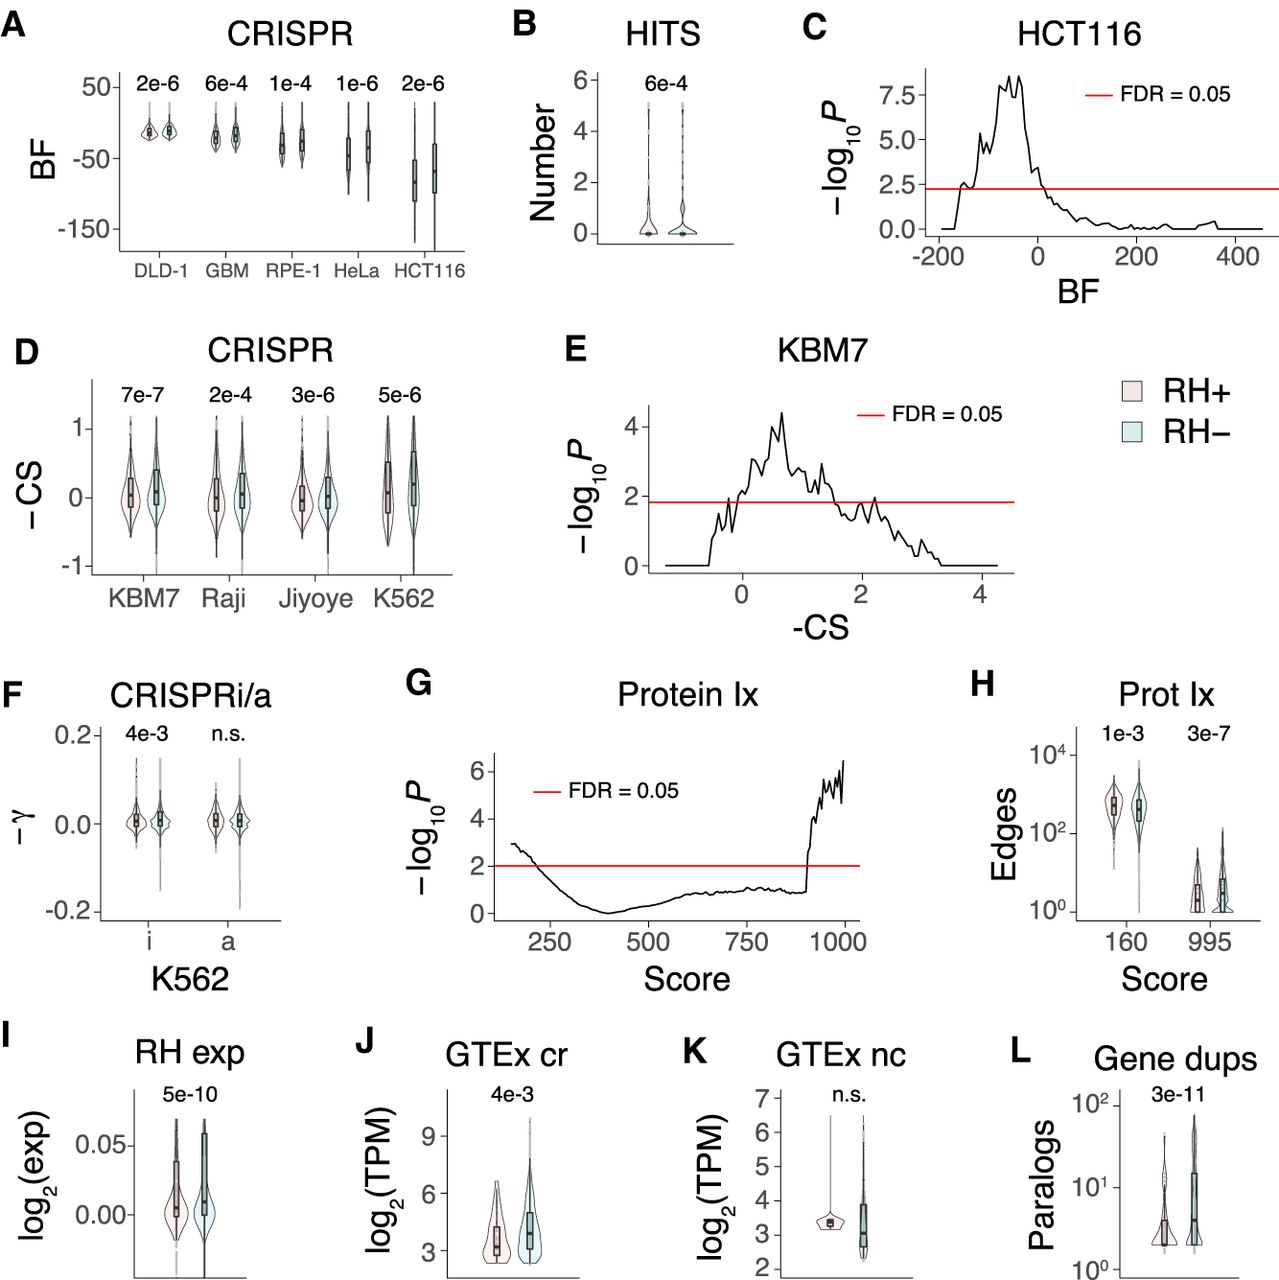
RH growth genes. (A) RH growth genes (RH+) have weaker CRISPR effects (Hart et al. 2015) than nongrowth RH genes (RH−). (BF) Bayes factor for growth effects in each cell line, P-values shown above comparisons. (B) Mean number of cell lines with a CRISPR hit is lower for RH growth genes. (C) Lack of overlap between RH and CRISPR growth genes in HCT116 cells. Abscissa shows threshold BF used to calculate overlap. (D) CRISPR scores (CS) for growth effects (Wang et al. 2015) multiplied by −1, so that higher scores mean stronger effects. (E) Lack of overlap between RH and CRISPR growth genes in KBM7 cells. (F) RH growth genes show weaker CRISPRi, but not CRISPRa, effects (−γ) in K562 cells (Gilbert et al. 2014). (G) RH growth genes have increased numbers of low-confidence protein–protein interactions and decreased numbers of high-confidence interactions. Score threshold (abscissa) is a measure of confidence. (H) Number of protein–protein interactions at most significant low-confidence score threshold (160) and most significant high-confidence threshold (995). (I) RH coding region growth genes have decreased expression compared to nongrowth genes in microarray data from a human RH panel. (J) Coding region (cr) RH growth genes have decreased expression compared to cr nongrowth genes in GTEx RNA-seq data from substantia nigra. (K) Noncoding (nc) RH growth and nongrowth genes show no significant expression differences in substantia nigra. (L) Decreased number of human paralogs (duplicates) for RH growth genes. P-values, Welch's two-sample t-test except in C and E, Fisher's exact test. (FDR) False discovery rate (Benjamini and Hochberg 1995). Transcripts per million (TPM) thresholded at ≥5.


