
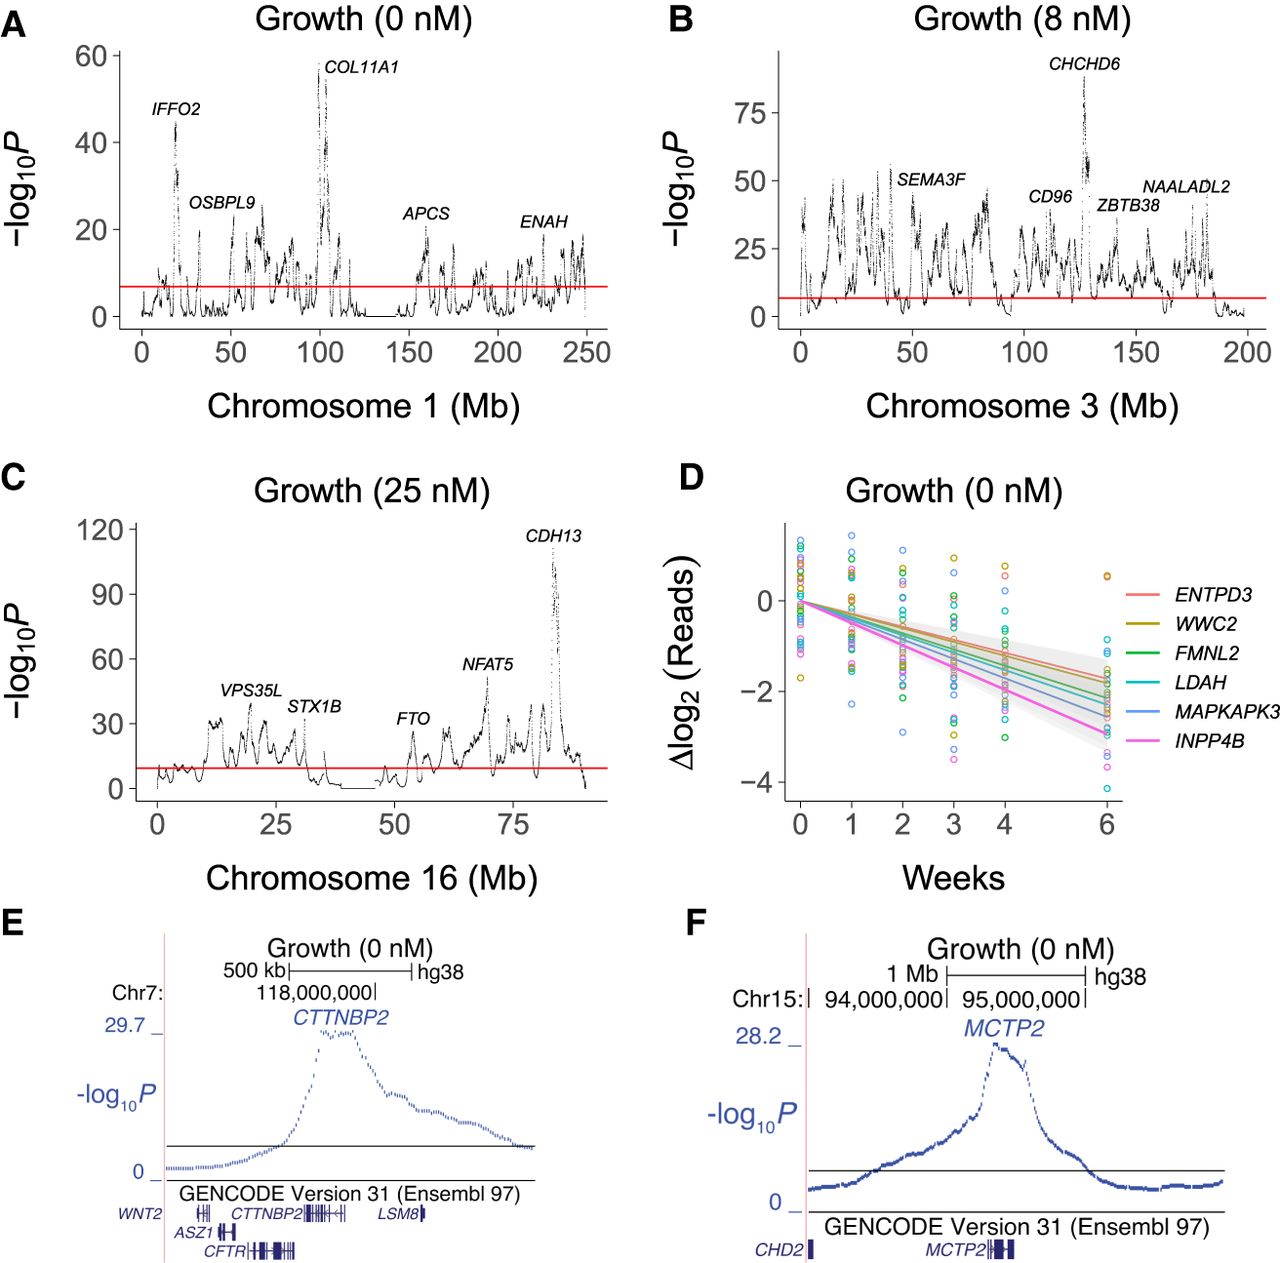
Figure 5.
Close up views of growth loci. (A) Chromosome 1. (B) Chromosome 3. (C) Chromosome 16. (D) Sequence read changes on log2 scale for six significant growth loci. Colored lines, best fit. Gray bands, 95% confidence intervals. (E) Locus for CTTNBP2 on Chromosome 7. (F) Locus for MCTP2 on Chromosome 15. Horizontal red and black lines, permutation significance thresholds.


