
Figure 4.
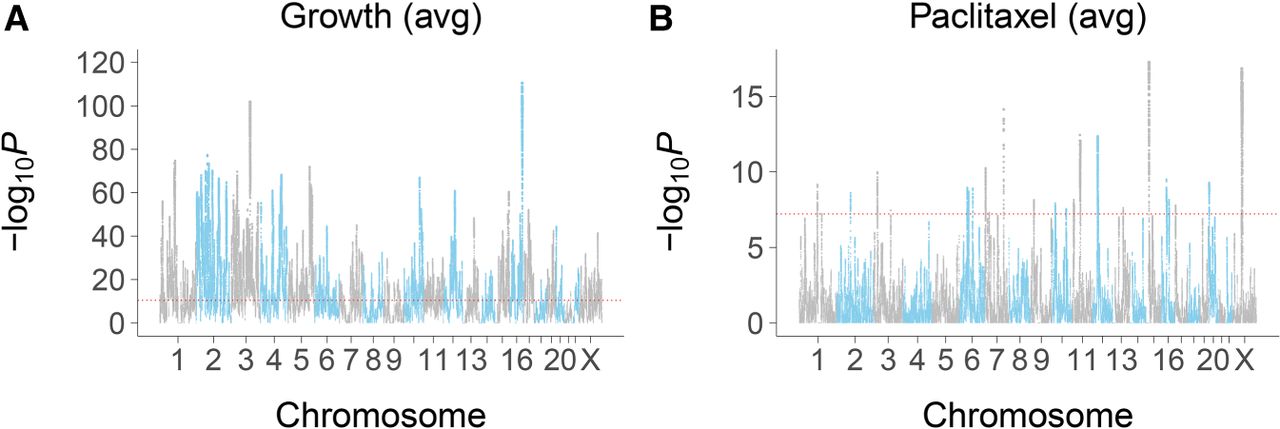
Loci for average conditional effects of growth and paclitaxel. (A) Significance values for growth. (B) Significance values for paclitaxel. Red dotted line, permutation significance threshold.
(Downloading may take up to 30 seconds. If the slide opens in your browser, select File -> Save As to save it.)
Click on image to view larger version.
Loci for average conditional effects of growth and paclitaxel. (A) Significance values for growth. (B) Significance values for paclitaxel. Red dotted line, permutation significance threshold.
 CiteULike
 Delicious
 Digg
Digg Facebook
 Google+
 Reddit
 Twitter
