
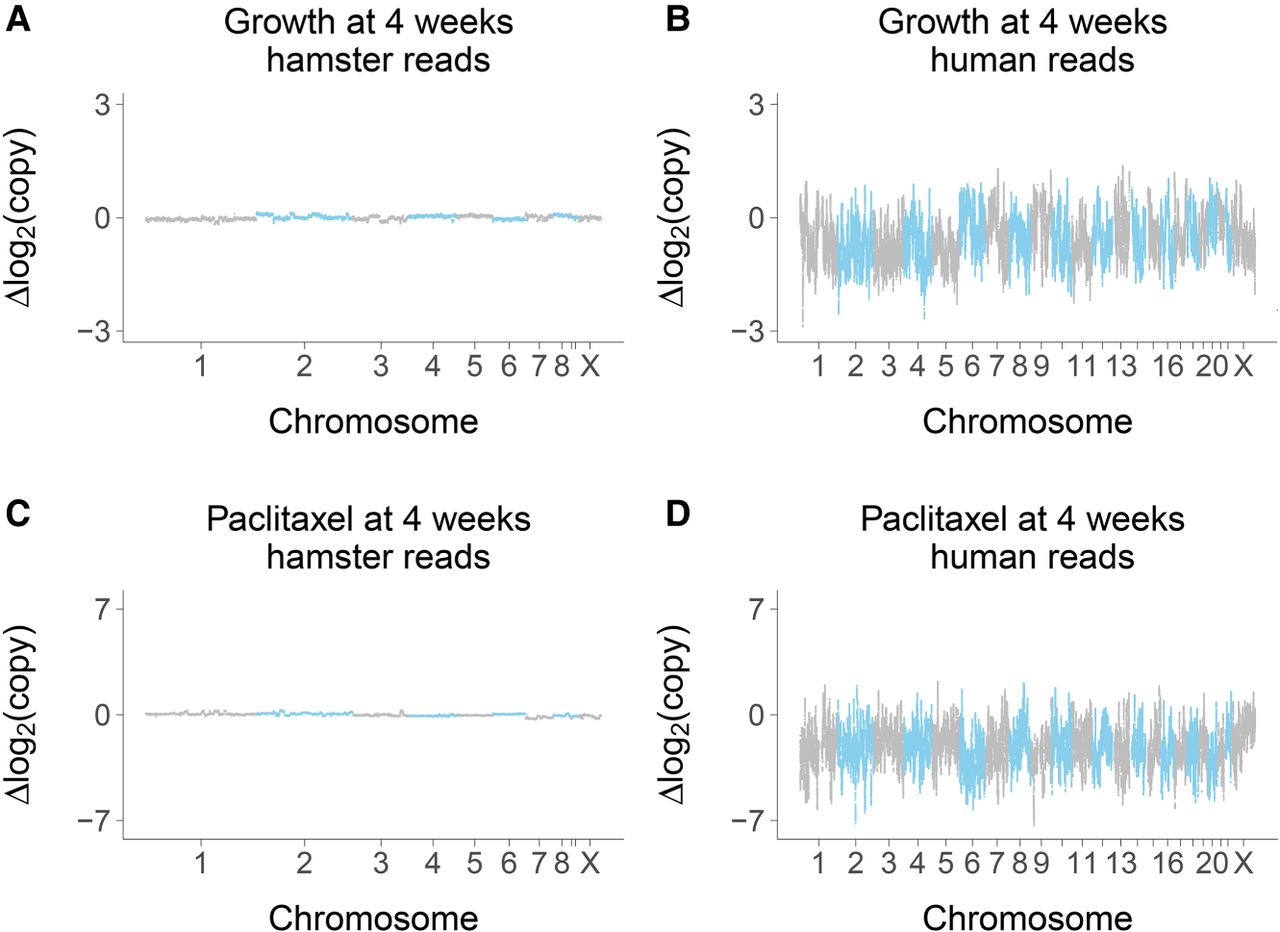
Figure 3.
Copy number changes at week 4. (A) Hamster genome, growth at week 4 compared to week 0; 0 nM paclitaxel. (B) Human genome, growth at week 4 compared to week 0; 0 nM paclitaxel. (C) Hamster genome, 75 nM paclitaxel compared to 0 nM paclitaxel; week 4. (D) Human genome, 75 nM paclitaxel compared to 0 nM paclitaxel; week 4. Changes on log2 scale averaged across the six RH pools.


