
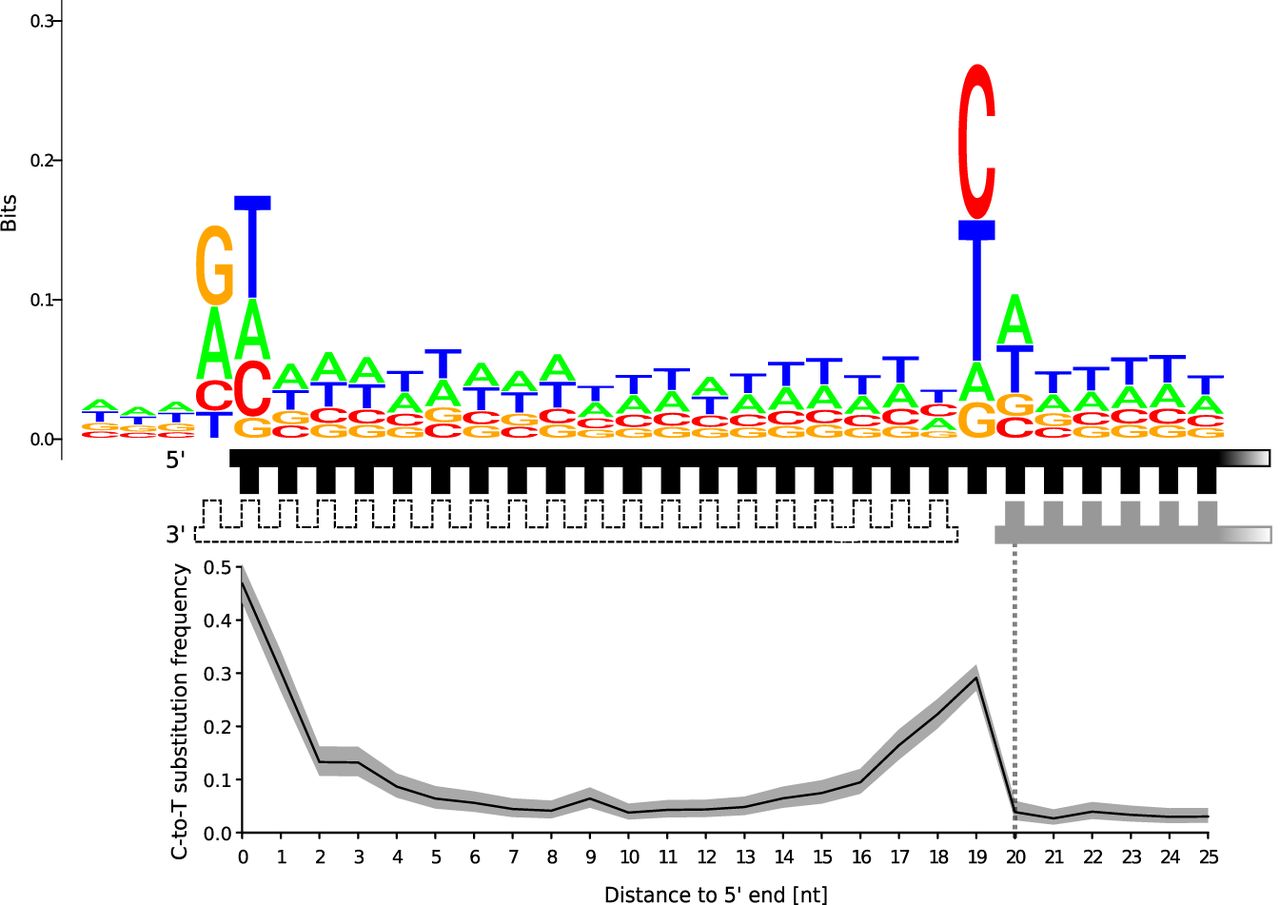
Figure 5.
C-to-T substitution frequencies and sequence logo plot of the reference base composition around Neanderthal molecules with 20-nt 5′ overhangs. A schematic representation of the alignments shows the strand used for calculating reference base composition and substitution frequencies (marked in black), the identified complementary strand (marked in gray), and a second complementary strand of unknown length that was putatively present (white fill). Note that the size of the gap is unknown. The gray area surrounding the C-to-T substitution frequencies denotes the 95% binomial confidence interval.


