
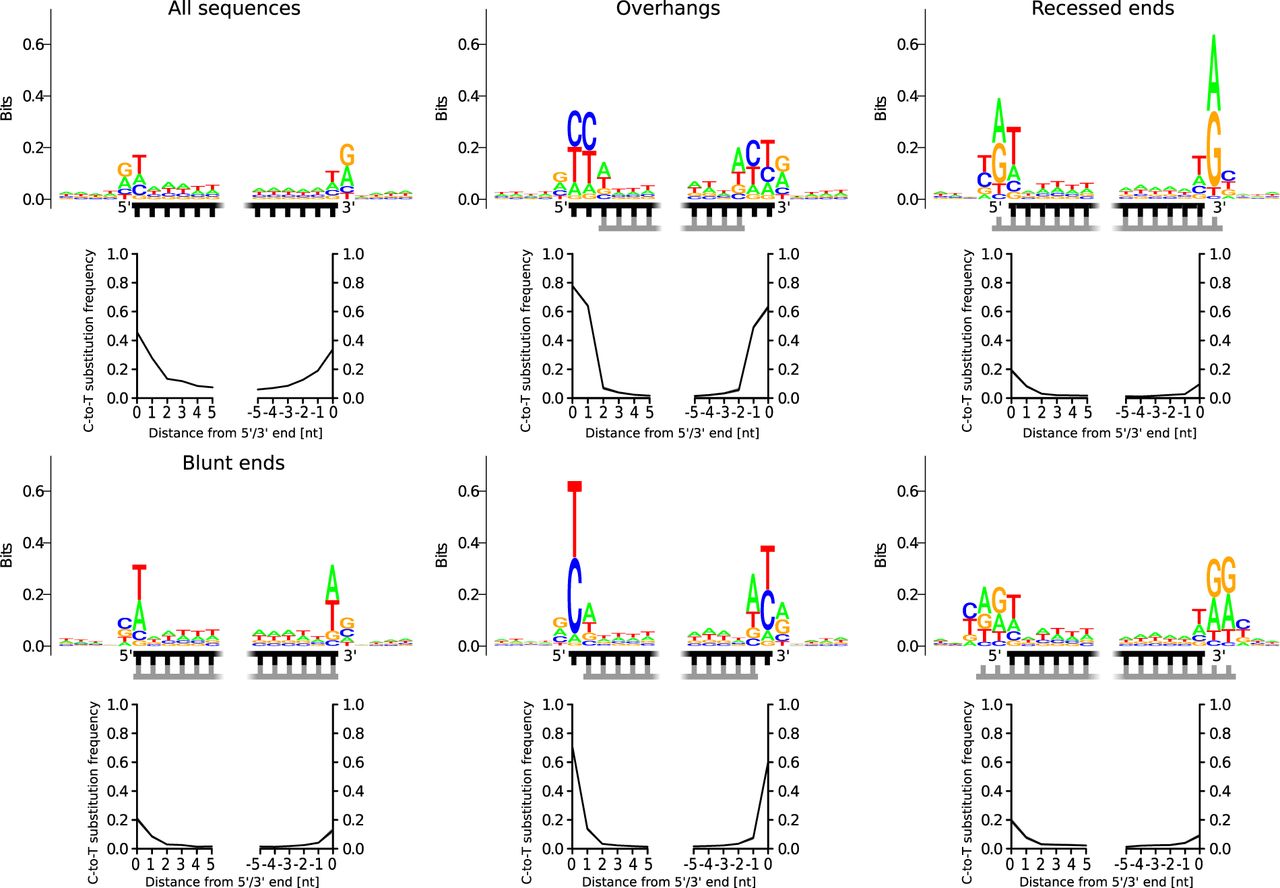
C-to-T substitution frequencies and reference base composition for the termini of Neanderthal sequences located in various structural contexts. The composition of the reference genome around alignment start and end points is shown in sequence logo plots, where the relative size of the letters is proportional to the frequency of each base. The total height of the letters (in bits) indicates how much the base composition deviates from randomness. The structure of the termini is indicated by schematic drawings. The strand that was used for calculating the reference base composition and substitution frequencies is marked in black; the complementary strand, in gray. The first (upper left) plot shows C-to-T substitution frequencies and reference base composition of all aligned sequences without stratification for structural context.


