
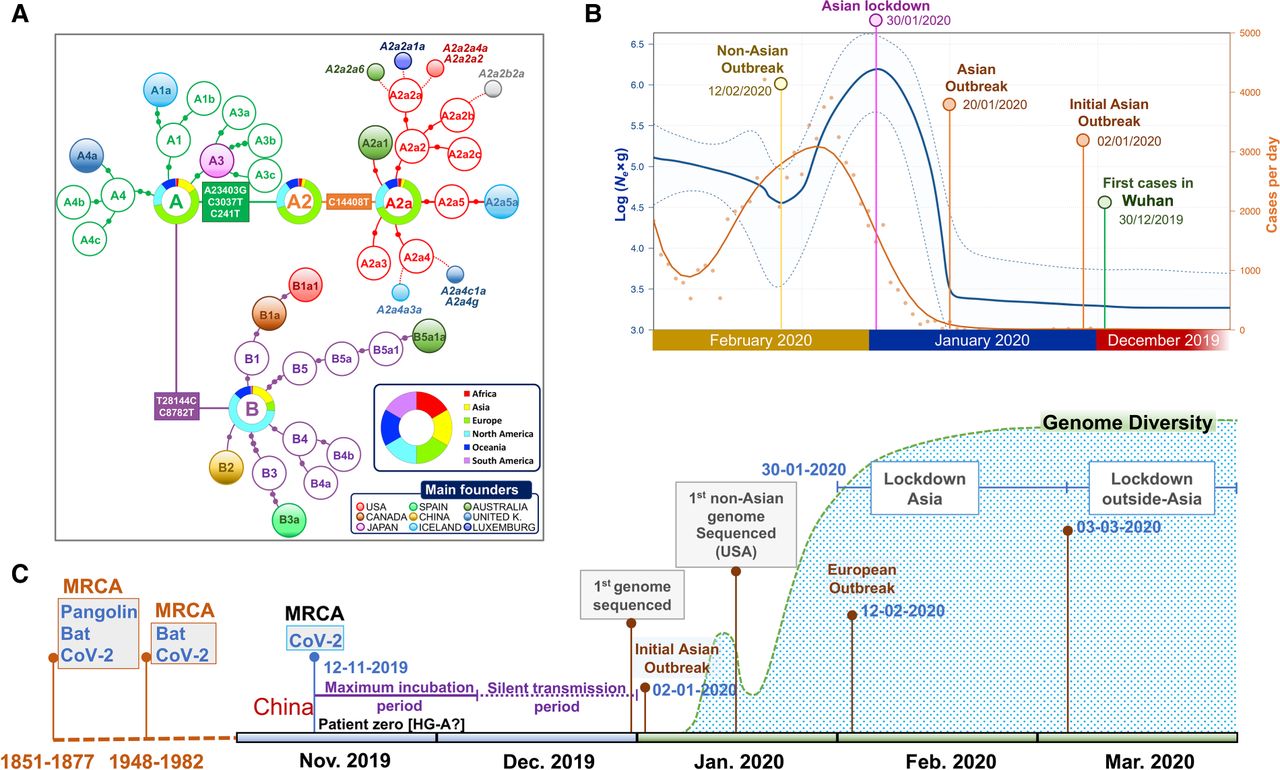
Phylogenetic and phylodynamics of SARS-CoV-2, and timeline of the pandemic. (A) Simplified SARS-CoV-2 phylogeny (schematic version of Fig. 3) illustrating the main worldwide branches and the haplogroups responsible for the main outbreaks (founders favored by super-spreading) occurring in Asia and outside Asia (colored filled circles). The overall distribution color keys refer only to pie charts, and the main founder color keys refer only to filled circles. (B) EBSP based on genomes sampled from the beginning of the pandemic until the end of February 2020 (n = 621). The orange distribution shows the real number of cases per day as recorded in https://ourworldindata.org for the same time period (we disregarded the abnormal peak occurring on February 13, 2020, because more than 15,000 new cases were reported in China in just 1 d, most likely representing unconfirmed cases). (C) Time line of the main events occurring during the pandemic, and indicating the MRCA of all SARS-CoV-2 genomes; the dotted area is a schematic representation of the real diversity values reported in Supplemental Figure S10 and Supplemental Table S3. Divergence dates between SARS-CoV-2 and bat sarbecoronavirus reservoir and between bat and pangolin coronaviruses were taken from Boni et al. (2020).


