
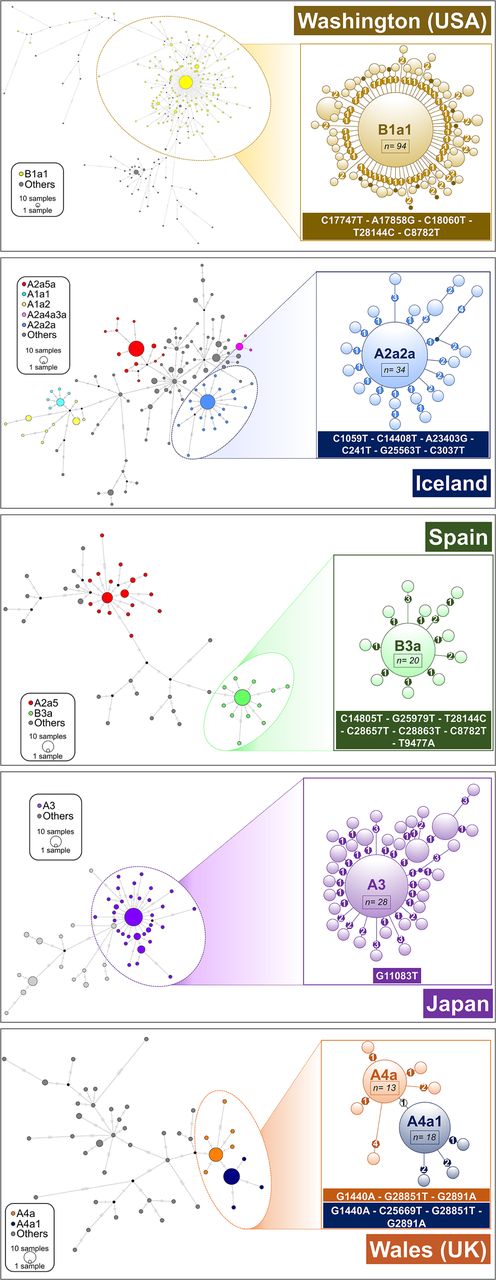
Figure 5.
Network analysis of main super-spreader candidates (see also Supplemental Data; Supplemental Table S4) in various geographic regions. A network was first computed for all the haplotypes in the region, and a zoomed network was built for the main super-spreader candidates. Areas of the circles are proportional to the number of haplotypes. In the case of B1a1 representation (Washington state; USA), only derived haplotypes from the core with one or two mutations are represented in the left subgraph. Heptagons in branches indicate the number of mutations in the corresponding branch.


