
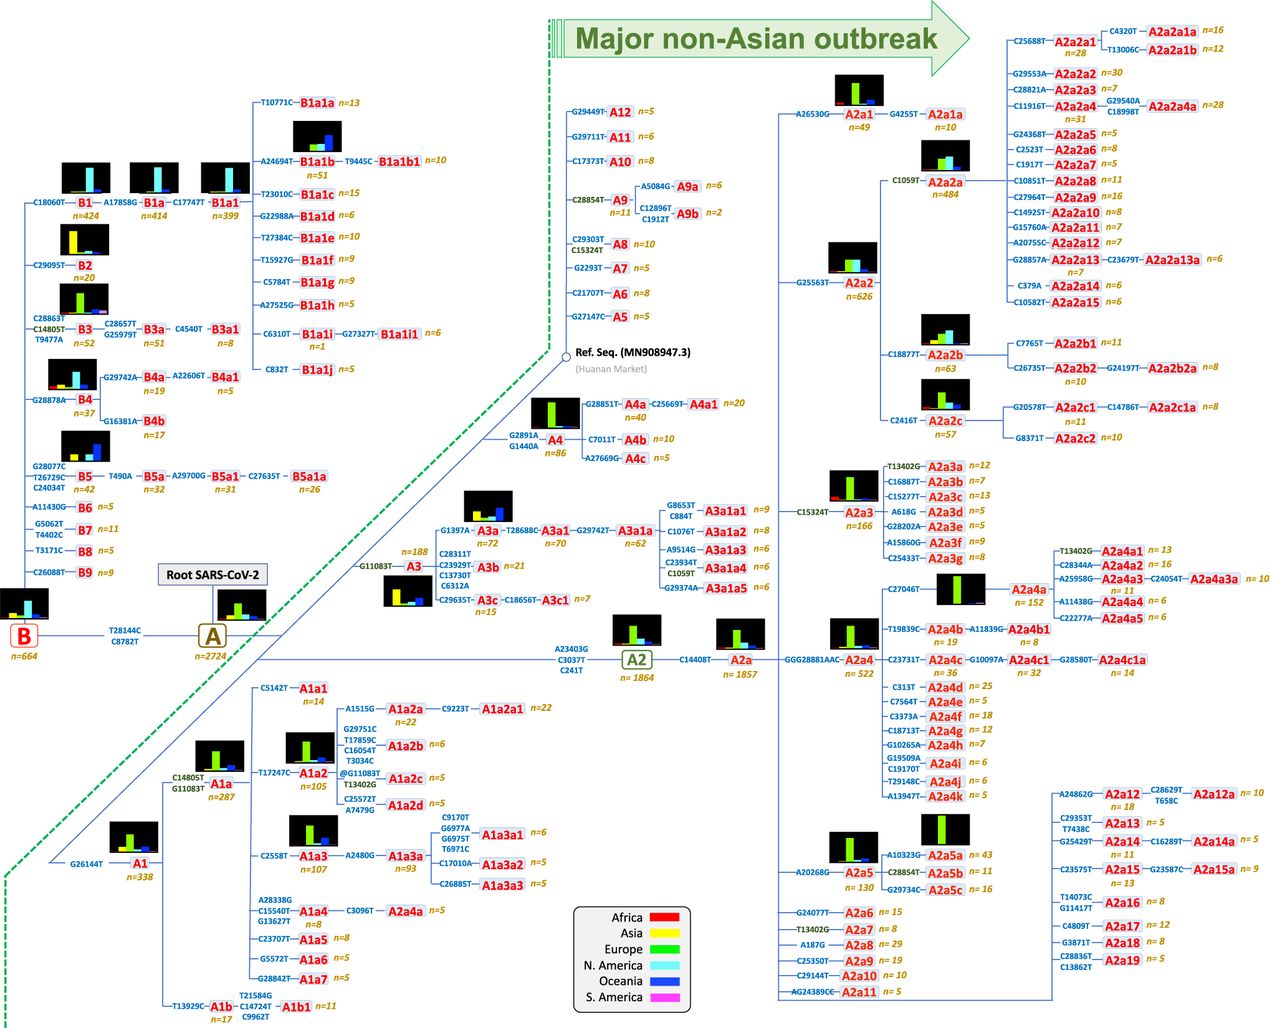
Figure 3.
Maximum parsimony tree of SARS-CoV-2 genomes. Small histograms represent relative frequencies of the given haplogroup or sub-haplogroup in the different regions. Mutations along branches are referred to changes against the reference sequence. Mutations in dark green indicate parallel events along the different branches of the phylogeny. Mutations with an @ symbol indicate reversions.


