
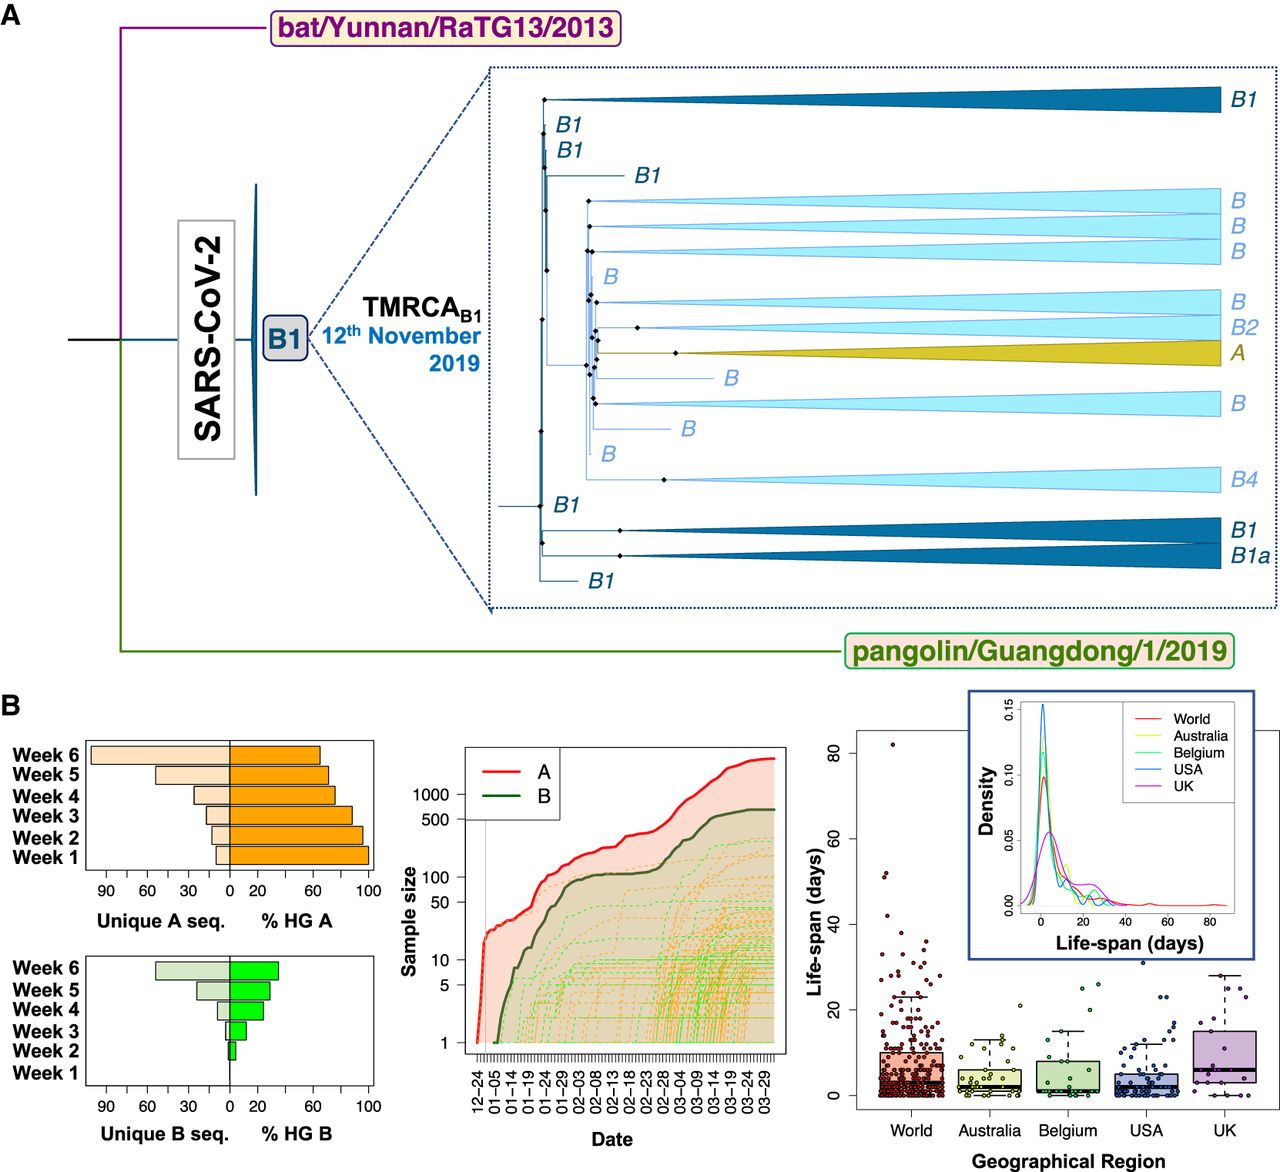
Contrasting evidence supporting different roots for SARS-CoV-2 genomes. (A) Interspecific ML tree using genomes sampled in GISAID before March 2020, indicating the root in haplogroup B1 for all existing SARS-CoV-2 genomes. (B, left) The histograms on the right represent the number of unique haplotypes belonging to haplogroups A and B accumulated during the first 6 wk of the pandemic, whereas the histograms on the left show the evolution of the frequencies of haplogroups A and B in the same period (note that A and B frequencies are complementary); (middle) growth of sample size of the main A branch (red solid line) and A sub-branches (red dashed lines) and the main B branch (green solid line) and B sub-branches (green dashed lines), indicating that B and derivative clades appear at a later moment of the pandemic than A and its subclades. The gray vertical line separates year 2019 from year 2020; (right) boxplot and density function of the life-span period of identical haplotypes in the database (as a proxy for the life-span period of a SARS-CoV-2 genome) worldwide and in various countries (by way of example, we only included those data sets having high sample sizes).


