
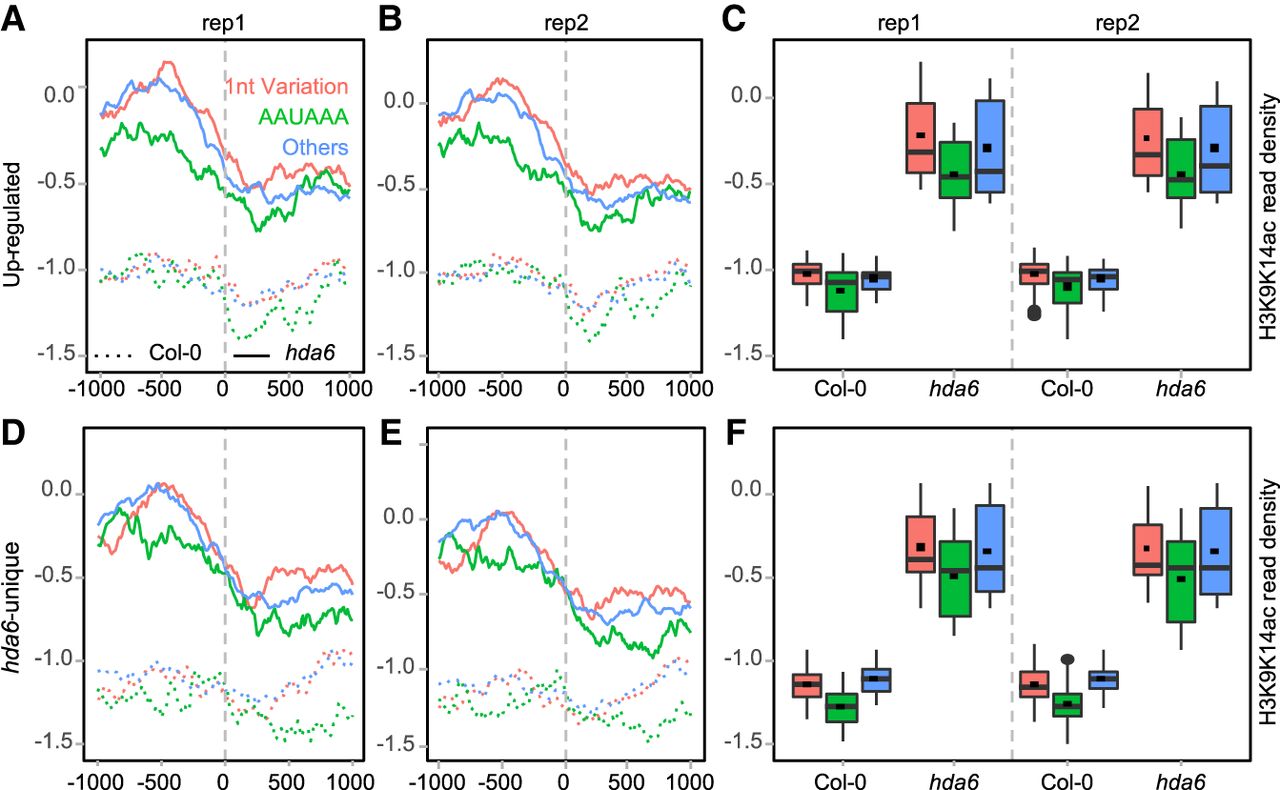
Figure 7.
Different poly(A) signals are associated with different H3K9K14ac profiles. The Wilcoxon signed-rank test was used to evaluate the statistical significance of the acetylation level differences, and P values are listed in Supplemental Table S7. (A–C) Up-regulated poly(A) sites. (D–F) hda6-unique poly(A) sites.


