
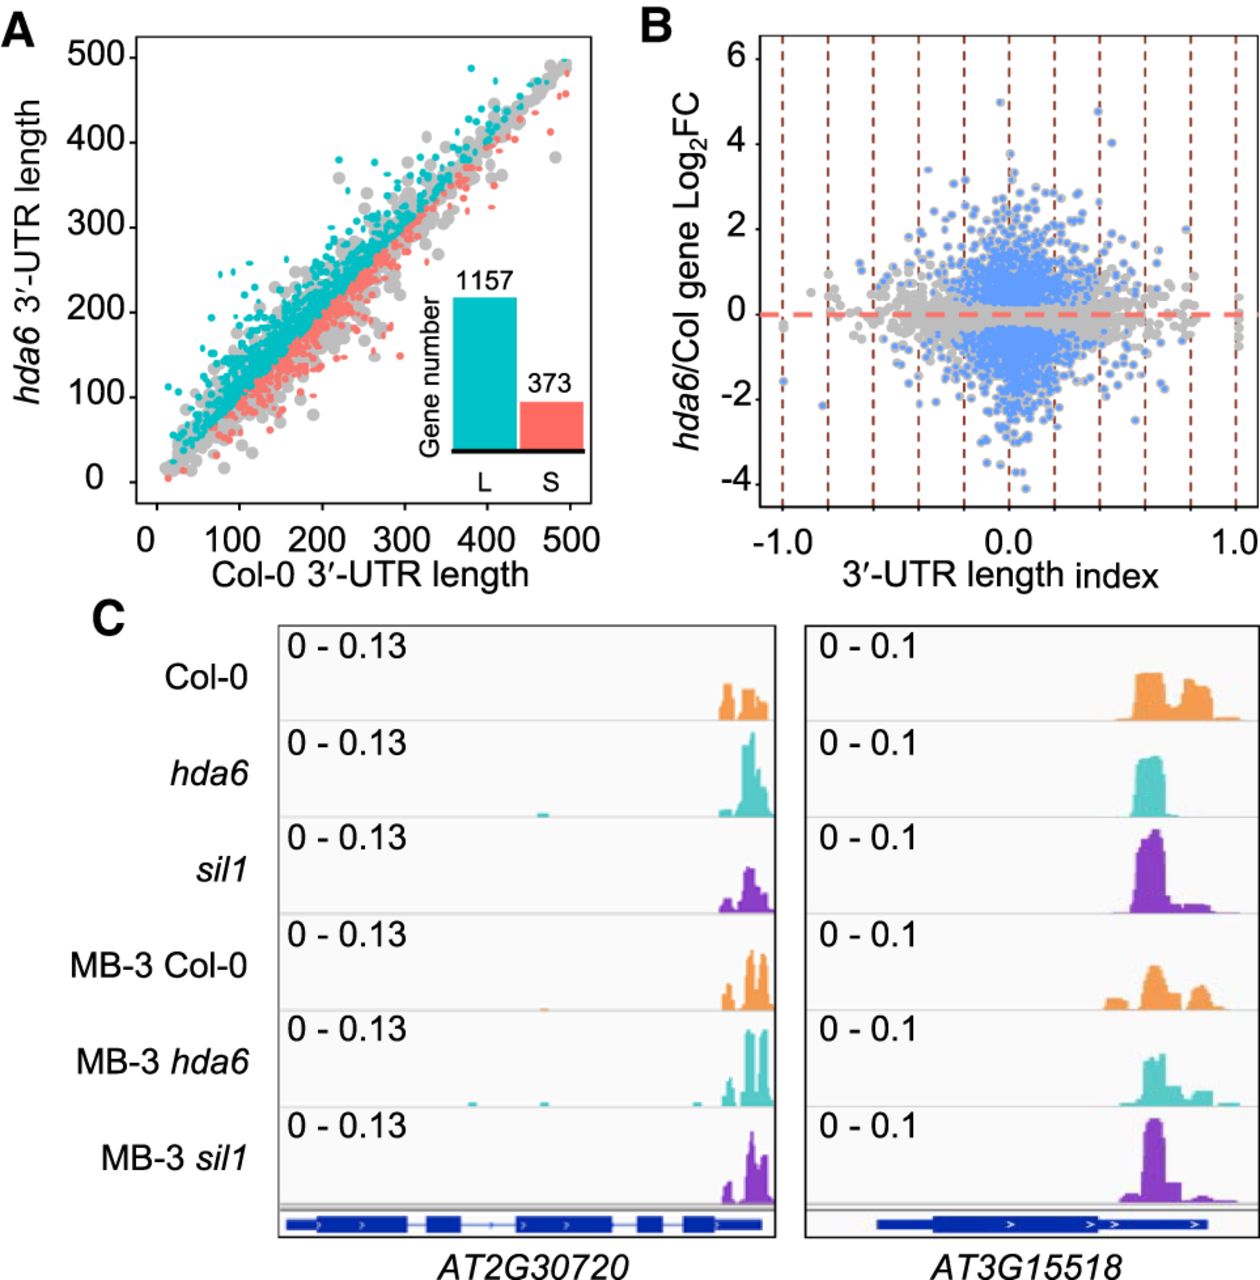
Figure 3.
3′-UTR length variation is independent of gene expression activity in hda6. (A) Scatter-plot of weighted 3′-UTR lengths of hda6 and Col-0. (L) 3′-UTR lengthening event, (S) 3′ UTR shortening event. (B) Effect of HDA6 on 3′-UTR length and gene expression are independent. Blue dots indicate DE genes (padj < 0.05) identified from RNA-seq profiles; red vertical dashed lines indicate 0.2 intervals of 3′-UTR length index (>0, lengthening; <0, shortening). (C) Examples of a 3′ UTR lengthening event (left panel) and a 3′ UTR shortening event (right panel), respectively. Scale of each sample is indicated by data range.


