
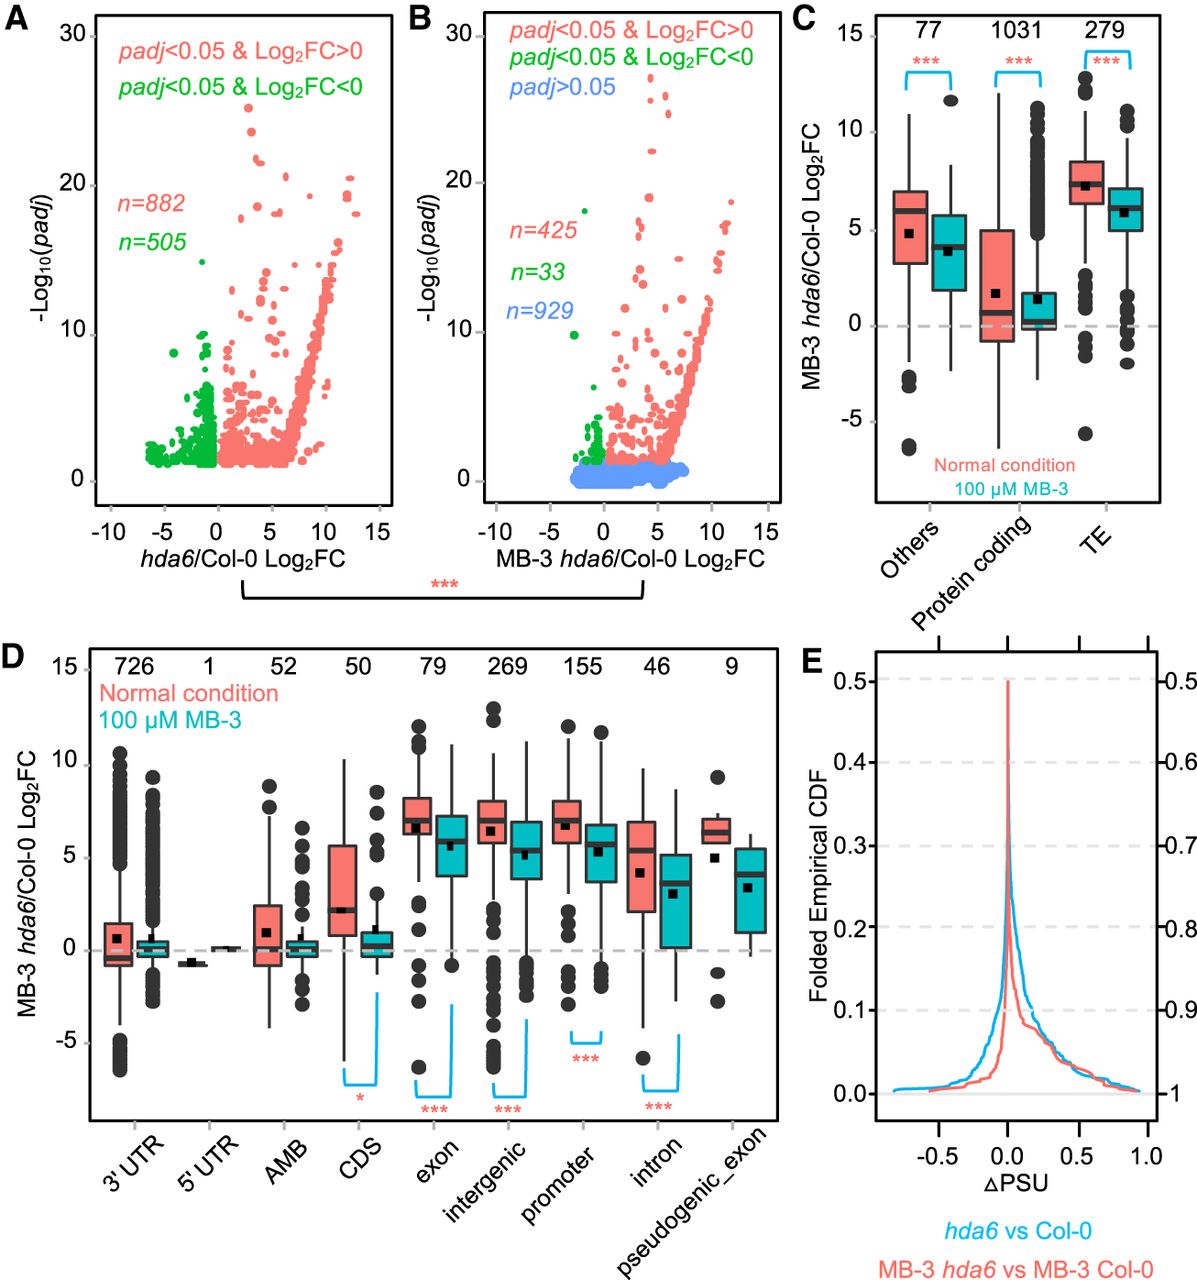
The histone acetyltransferase inhibitor partially restored the effect of hda6 on polyadenylation. DE poly(A) sites (padj < 0.05) between hda6 and Col-0 are used for plotting. (***) Wilcoxon signed-rank test P < 0.001; (*) P < 0.05, when compared to nontreated groups. (A) More poly(A) transcripts are up-regulated in hda6. Log2FC indicates log2 of fold change of gene expression level. (B) MB-3 treatment minimizes the DE counts between hda6 and Col-0. (C,D) Distribution of DE poly(A) sites. Counts of poly(A) sites in each category are shown on the top of boxes. (TE) Transposon elements, (AMB) ambiguous regions which have overlapped features. Lines and dots in the boxes indicate the medians and means, respectively. (E) MB-3 treatment reduces the difference of PSUs between hda6 and Col-0. ΔPSU represents the difference of PSU of a poly(A) site in hda6 and Col-0.


