
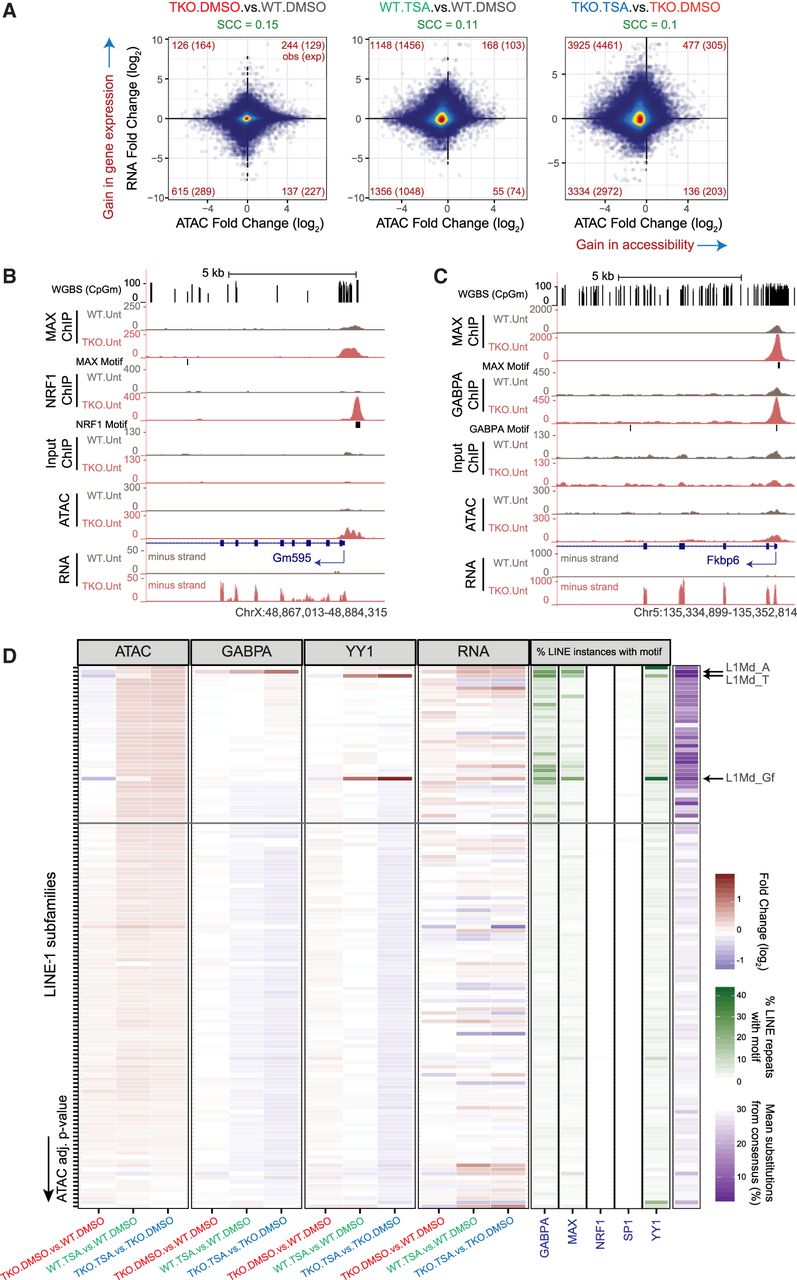
DNA methylation loss and HDAC inhibition affect the expression of specific genes and retrotransposons. (A) Changes in accessibility at every THS region were compared to changes in expression at their closest gene. The analysis was performed on 60052 THS:gene pairs involving 15,298 genes. The numbers of THSs associated with significant changes in both accessibility and gene expression are indicated in red in each quadrant. In parentheses are indicated the expected numbers of sites showing both significant changes in accessibility and gene expression based on the total number of significant differential events. SCC = Spearman's correlation coefficient. (B,C) Representative UCSC Genome Browser snapshots showing CpG methylation levels, ChIP-seq, ATAC-seq, and strand-specific RNA-seq read coverage. The position of genes and that of sequences that match the TF motifs are shown. (D) For each LINE-1 subtype (N = 132), we plotted the fold change in ATAC-seq, ChIP-seq, or RNA-seq signal along with scores relating to their sequence conservation (purple) or the presence of selected TF binding motifs (green). LINE-1 subtypes were sorted based on ATAC-seq adjusted P-values when comparing TSA- to DMSO- treated DNMT.TKO cells. See also Supplemental Table S3.


