
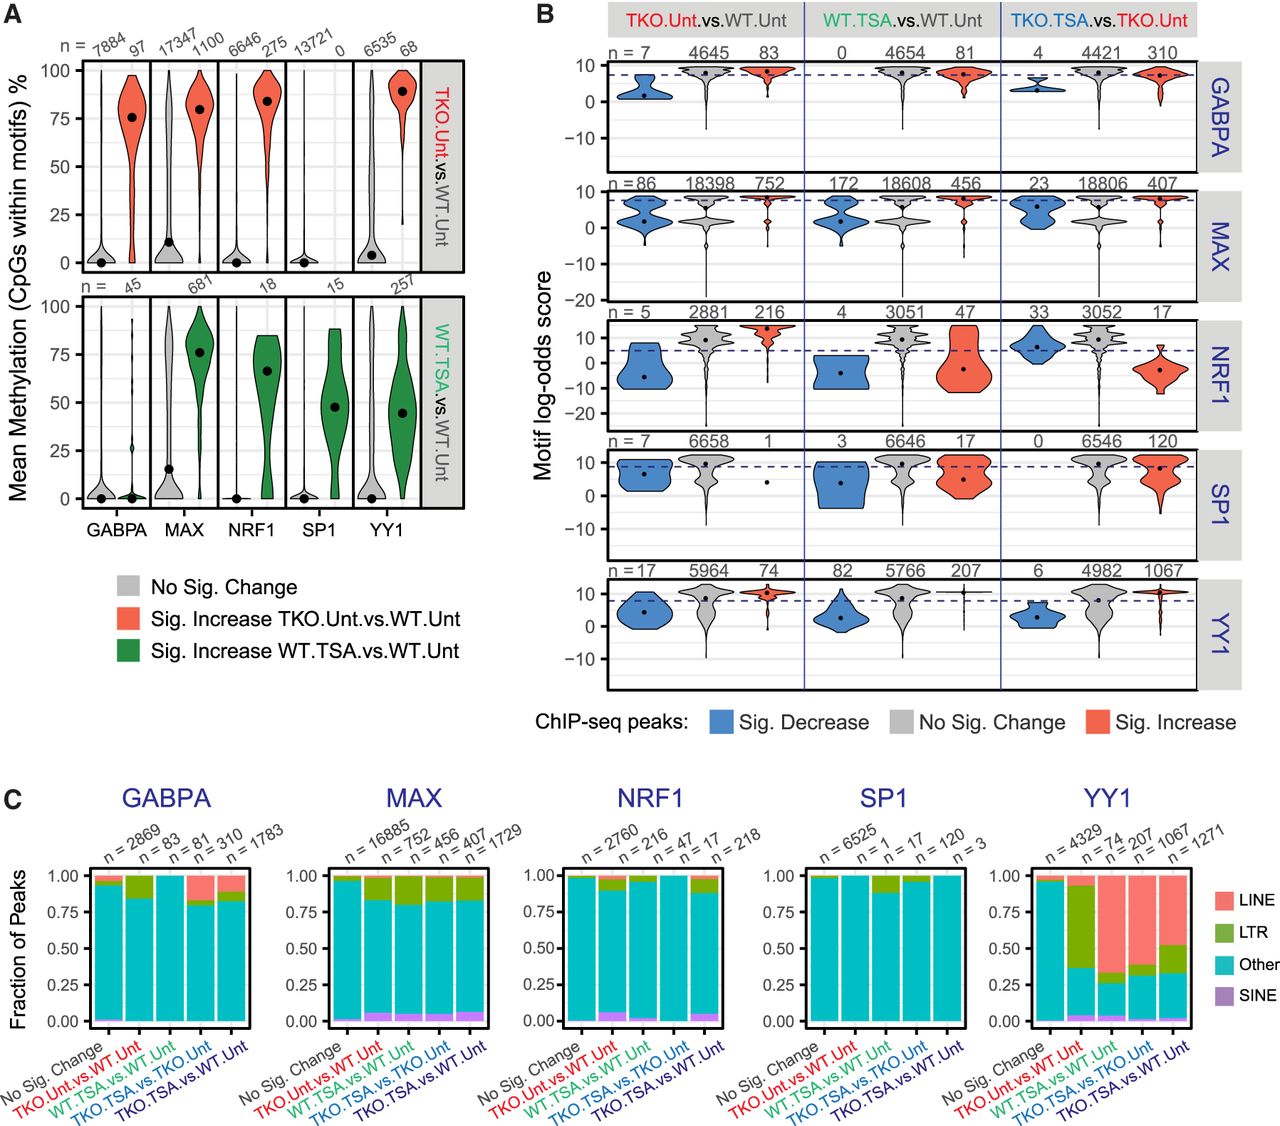
Characteristics of transcription factor (TF) binding sites. (A) Distribution of CpG methylation levels within the TF motifs that underlie ChIP-seq peaks. For each TF, we isolated all sequences that were located within peak regions that matched the relevant position weight matrix and determined the methylation status of the CpG nucleotides. CpG sites are grouped according to their differential occupancy. Black dots indicate the median. (B) Distribution of maximum log-odds scores found at different subsets of ChIP-seq peaks. Within each interval of the GABPA, MAX, NRF1, SP1, and YY1 peak-sets, the sequence most similar to the respective PWM was identified and its log-odds score, indicative of the deviation from the consensus sequence, was plotted. Black dots indicate the median. The dashed lines indicate the log-odds score threshold above which a sequence is said to match the PWM. (C) Fraction of ChIP-seq peaks that overlap an annotated transposable element. ChIP-seq peaks are classified based on their differential occupancy.


