
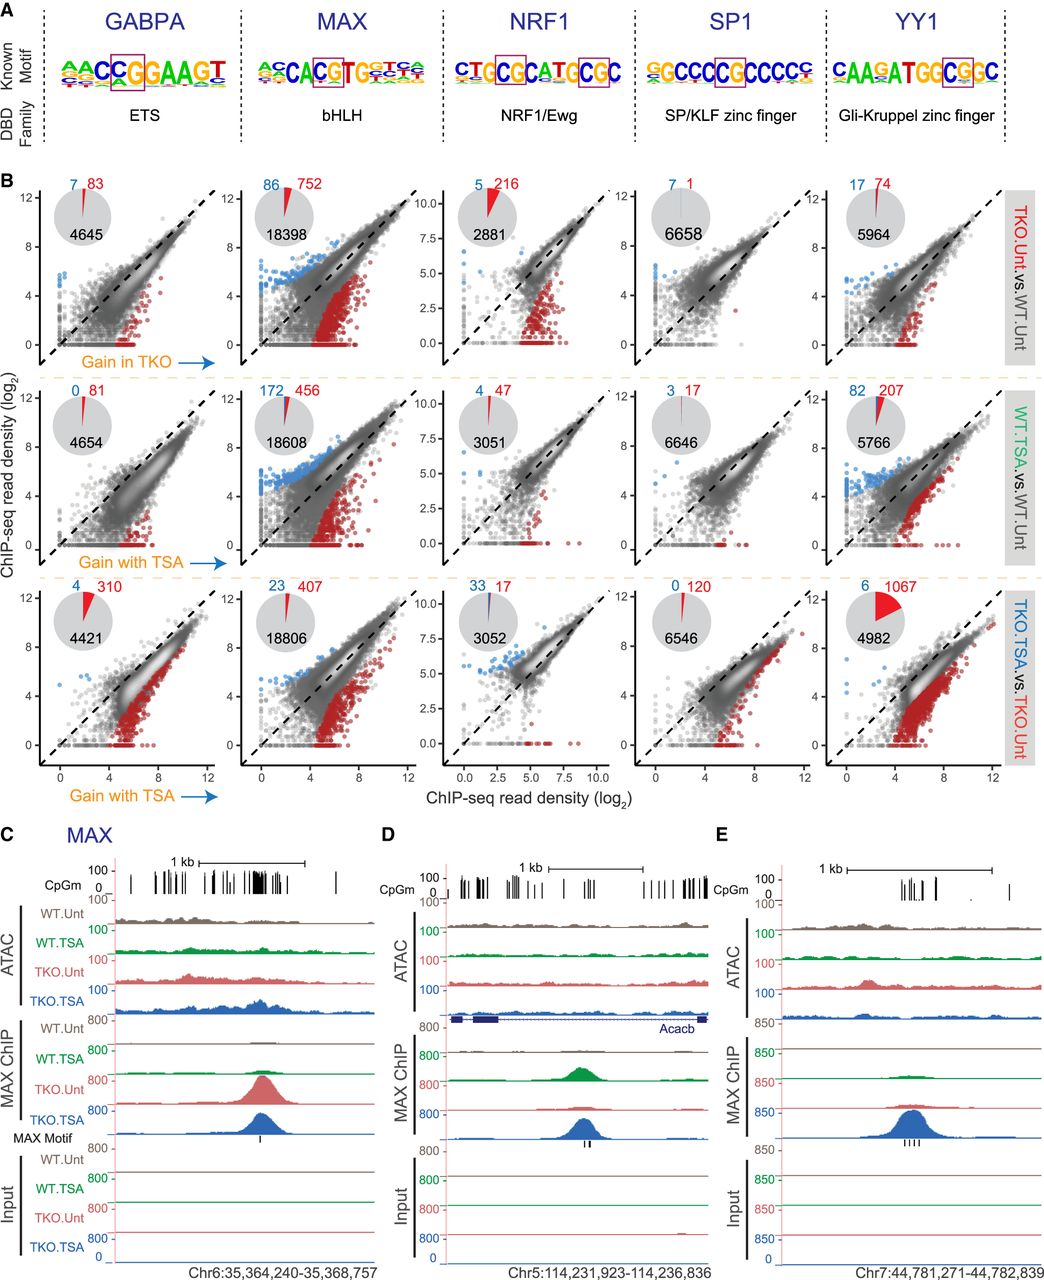
DNA methylation and HDAC activity can modulate transcription factor occupancy. (A) For each transcription factor, the position weight matrix (PWM) of its known motif and its DNA-binding domain (DBD) type are shown. (B) Pairwise comparisons of normalized GABPA, MAX, NRF1, SP1, or YY1 ChIP-seq signal for all identified occupancy peaks. Regions with significantly differential occupancy are colored on the scatterplots, and their numbers are summarized in the form of pie charts (light blue = significant decrease; red = significant increase). ChIP-seq signal from three biological replicate samples was averaged. (C–E) Representative UCSC Genome Browser snapshots showing CpG methylation levels, ATAC-seq, MAX ChIP-seq, and Input ChIP-seq read coverage.


