
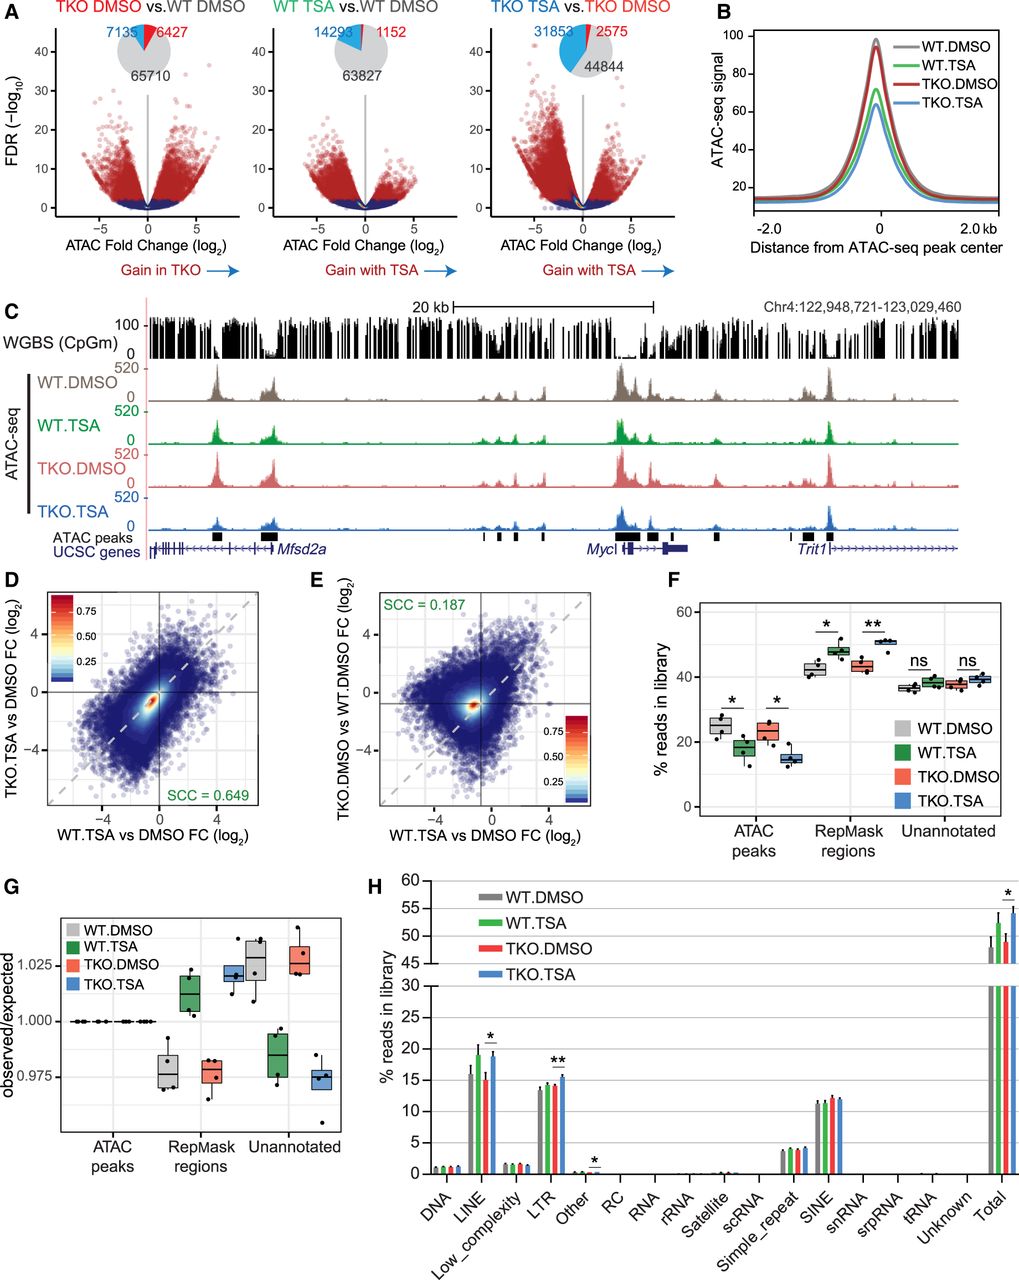
DNA methylation and HDAC activity have distinct contributions to the chromatin accessibility landscape. (A) Volcano plots representing the false discovery rate (FDR) and fold change values obtained through pairwise differential analyses of ATAC-seq signal at 83,395 THSs. Regions with significantly differential accessibility are shown in red on the scatterplots and their numbers are summarized in the form of pie charts (light blue = significant decrease; red = significant increase). (B) Metaplot showing the average ATAC-seq signal from DMSO- or TSA-treated wild-type and DNMT.TKO cells in 4-kb regions surrounding the center of THSs (n = 83,395). (C) Representative UCSC Genome Browser snapshot showing CpG methylation levels and ATAC-seq read coverage. (D) Scatterplot comparing the fold change in ATAC-seq signal following TSA treatment in DNMT.TKO versus wild-type cells. (E) Scatterplot comparing the fold change in ATAC-seq signal after loss of DNA methylation versus the change seen following TSA treatment in wild-type cells at 83,395 THSs. In D and E, the dashed line has a slope of 1 and intercept of 0. Colors indicate density of points per graph area. SCC = Spearman's correlation coefficient. (F) Box plots summarizing the percentage of reads from each ATAC-seq library that map to intervals split into three mutually exclusive categories. Two-tailed Student's t-tests; (*) P-value < 0.05, (**) P-value < 0.01, (ns) nonsignificant (P-value > 0.05). (G) Box plots summarizing the distribution of reads from each ATAC-seq library that map to intervals split into three mutually exclusive categories, relative to the distribution expected by chance, that is, if non-THS reads were shuffled randomly within the genomic space outside of THSs. Values shown in F are divided by those in Supplemental Figure S3B. (H) Distribution of ATAC-seq reads across different classes of repetitive elements as a percentage of the total library size. Data are represented as mean + SD. Two-tailed Student's t-tests; (*) P-value < 0.05, (**) P-value < 0.01, nonsignificant differences are not indicated.


