
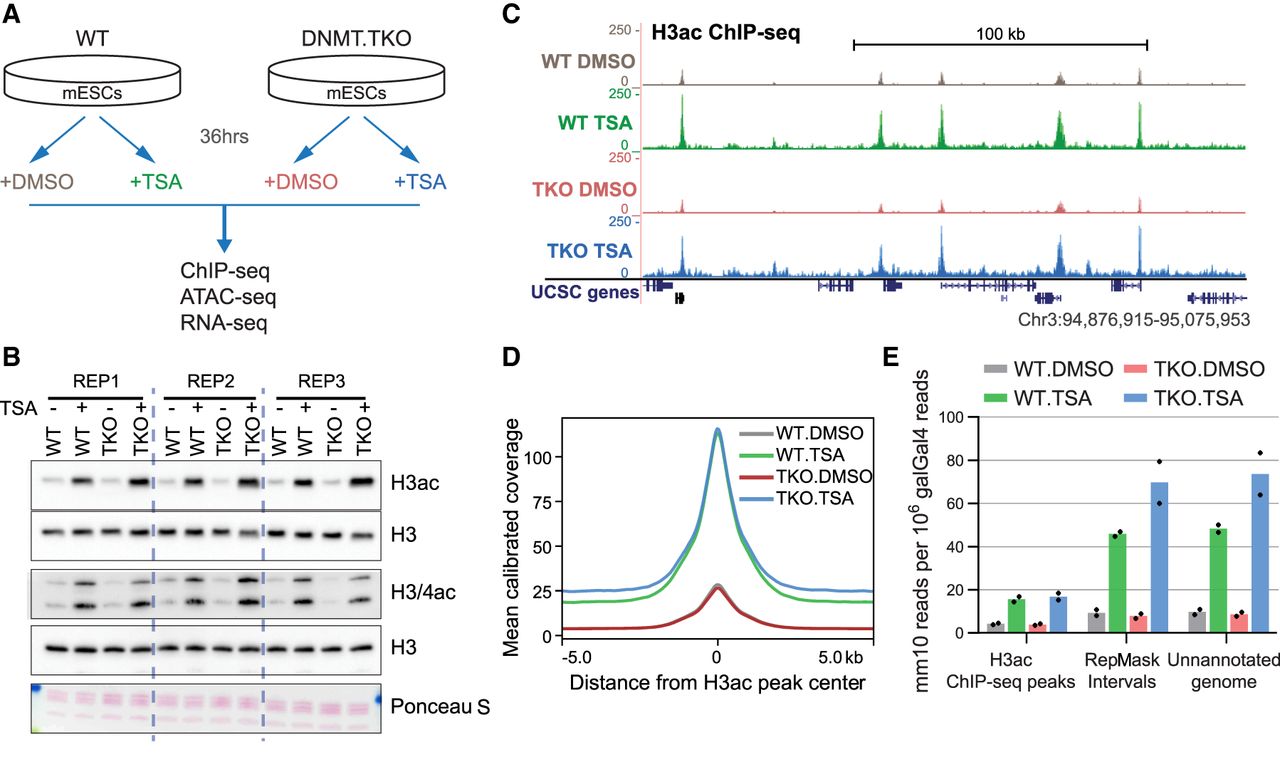
Disruption of HDAC activity and DNA methylation in mouse embryonic stem cells. (A) Schematic of the experimental approach used in this study. (B) Immunoblot analysis of global histone H3 and H4 acetylation levels after 36-h TSA treatment in mESCs. Samples were derived from three biological replicate experiments. (C) Representative snapshot of genomic region showing H3ac ChIP-seq read coverage calibrated to the spike-in galGal4 genome. (D) Metaplot showing the average calibrated H3ac ChIP-seq signal from DMSO- or TSA-treated wild-type and DNMT.TKO cells in 10-kb regions surrounding the center of ChIP-seq peaks (n = 28608). (E) Distribution of H3ac ChIP-seq reads within genomic intervals separated into three mutually exclusive categories. For every sample, the number of mm10 reads overlapping each category was divided by the total number of reads mapping to the galGal4 genome. Data are represented as the mean; points indicate the values for two biological replicates.


