
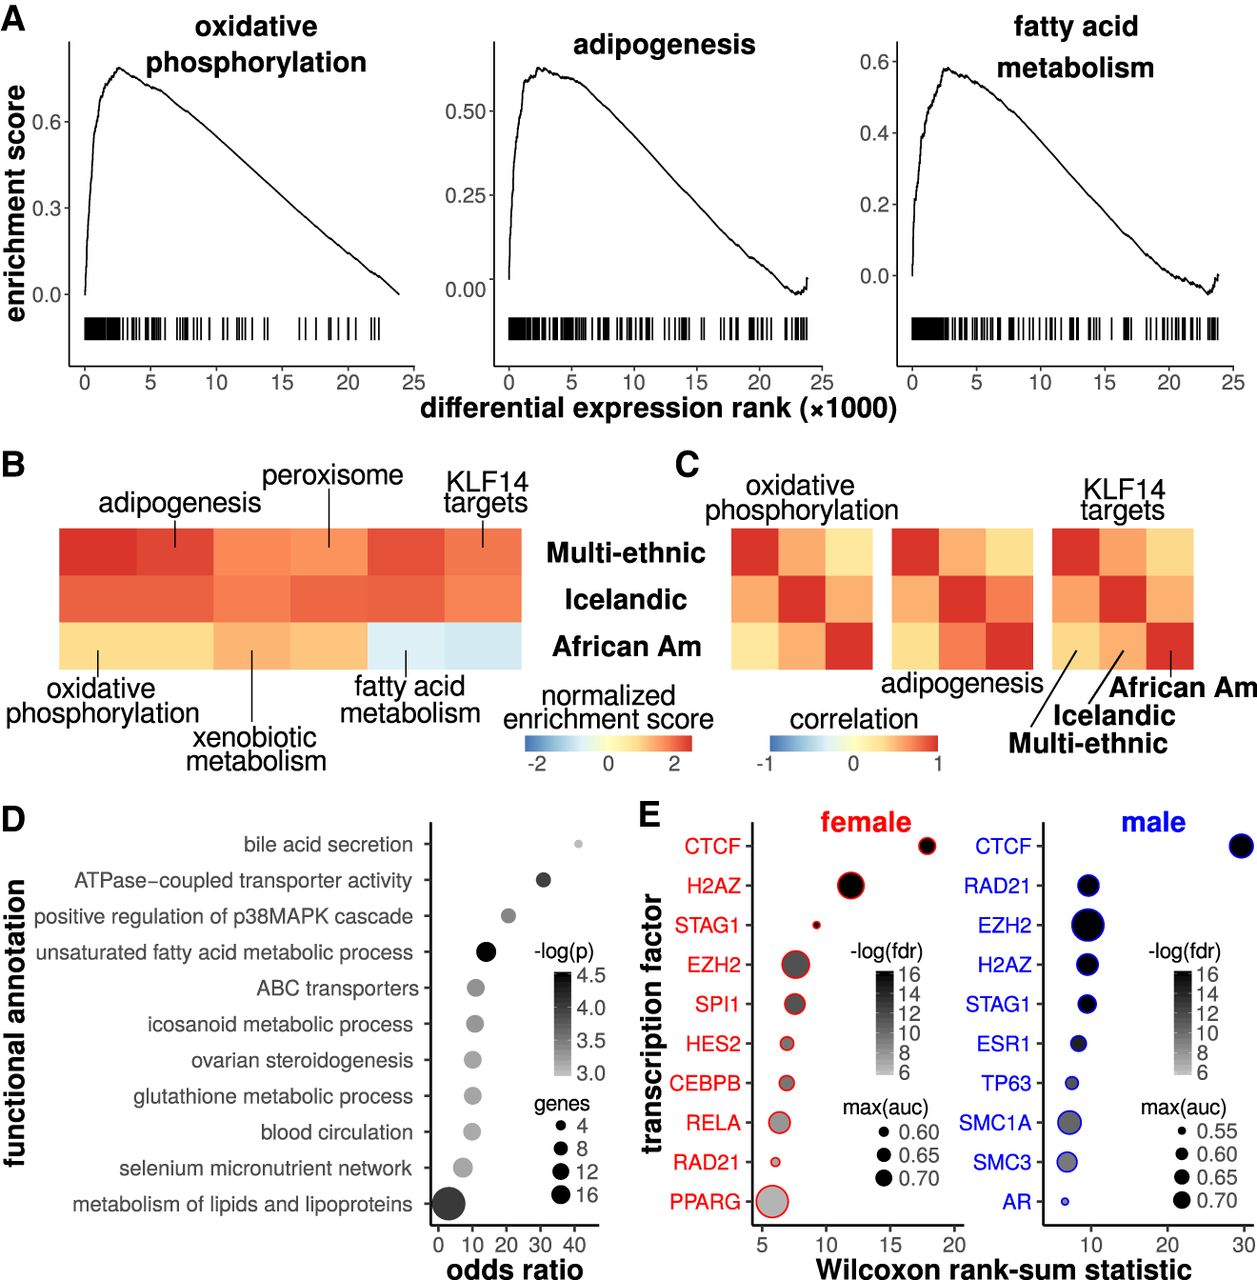
Sex-biased genes are implicated in oxidative phosphorylation and adipogenesis. (A) Gene set enrichment analysis (GSEA) enrichment scores are plotted as a function of the ranked degree of differential expression. Tick marks indicate genes from a specific functional annotation (e.g., oxidative phosphorylation). An elevated density of tick marks to the left suggests that genes with elevated expression in females are enriched for the functional annotation. (B) Normalized peak enrichment scores are shown for annotations with FDR < 0.1 for the multi-ethnic and Icelandic cohorts. (C) Positive fold change correlations across cohorts suggest that the enrichments are directionally consistent across cohorts. (D) Functional enrichment results based on Fisher's exact test (FET) are shown for 162 differentially expressed genes (FET P < 0.001). The point size indicates the number of genes in the functional annotation and the intensity indicates the negative log of the P-value. (E) We implemented the Binding Analysis for Regulation of Transcription (BART) for genes that were elevated in females (left) or elevated in males (right). The plots show the top 10 factors for each sex, ranked according to the Wilcoxon rank-sum test FDR (< 0.05). The point size indicates the maximal area under the receiver operator characteristic curve, a measure of the corresponding factor's putative regulatory influence on the gene set, and the intensity indicates the negative log of the FDR.


