
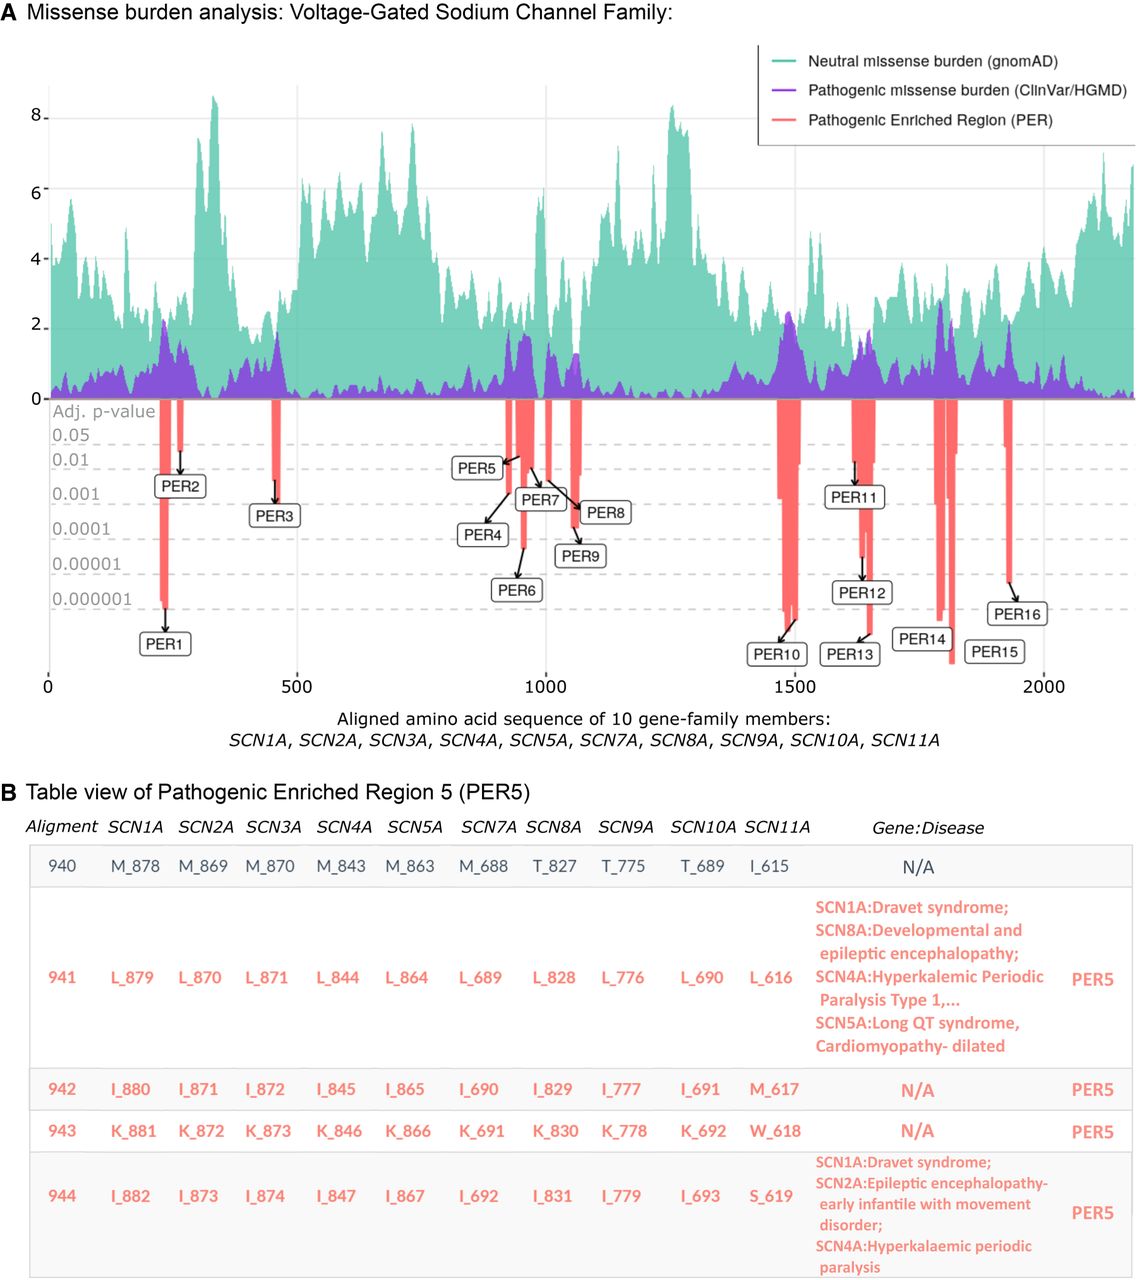
PER viewer tool example. The voltage-gated sodium channel family. (A) Missense burden analysis of the voltage-gated sodium channel protein family (family ID: 2614.subset.3) composed by SCN1A, SCN2A, SCN3A, SCN4A, SCN5A, SCN7A, SCN8A, SCN9A, SCN10A, and SCN11A. Population and patient missense burden are shown in green and purple, respectively. Significant pathogenic enriched regions (PERs) identified are shown in the red negative area and are proportional to their adjusted P-values (gray horizontal lines). (B) Table view of pathogenic enriched region 5 (PER5; positions 941–949). Gene columns denote individual canonical sequence alongside corresponding amino acid position. Column “Gene:Disease” displays analogous diseases observed in the patient data set. N/A sites show aligned amino acids positions with no disease reported.


