
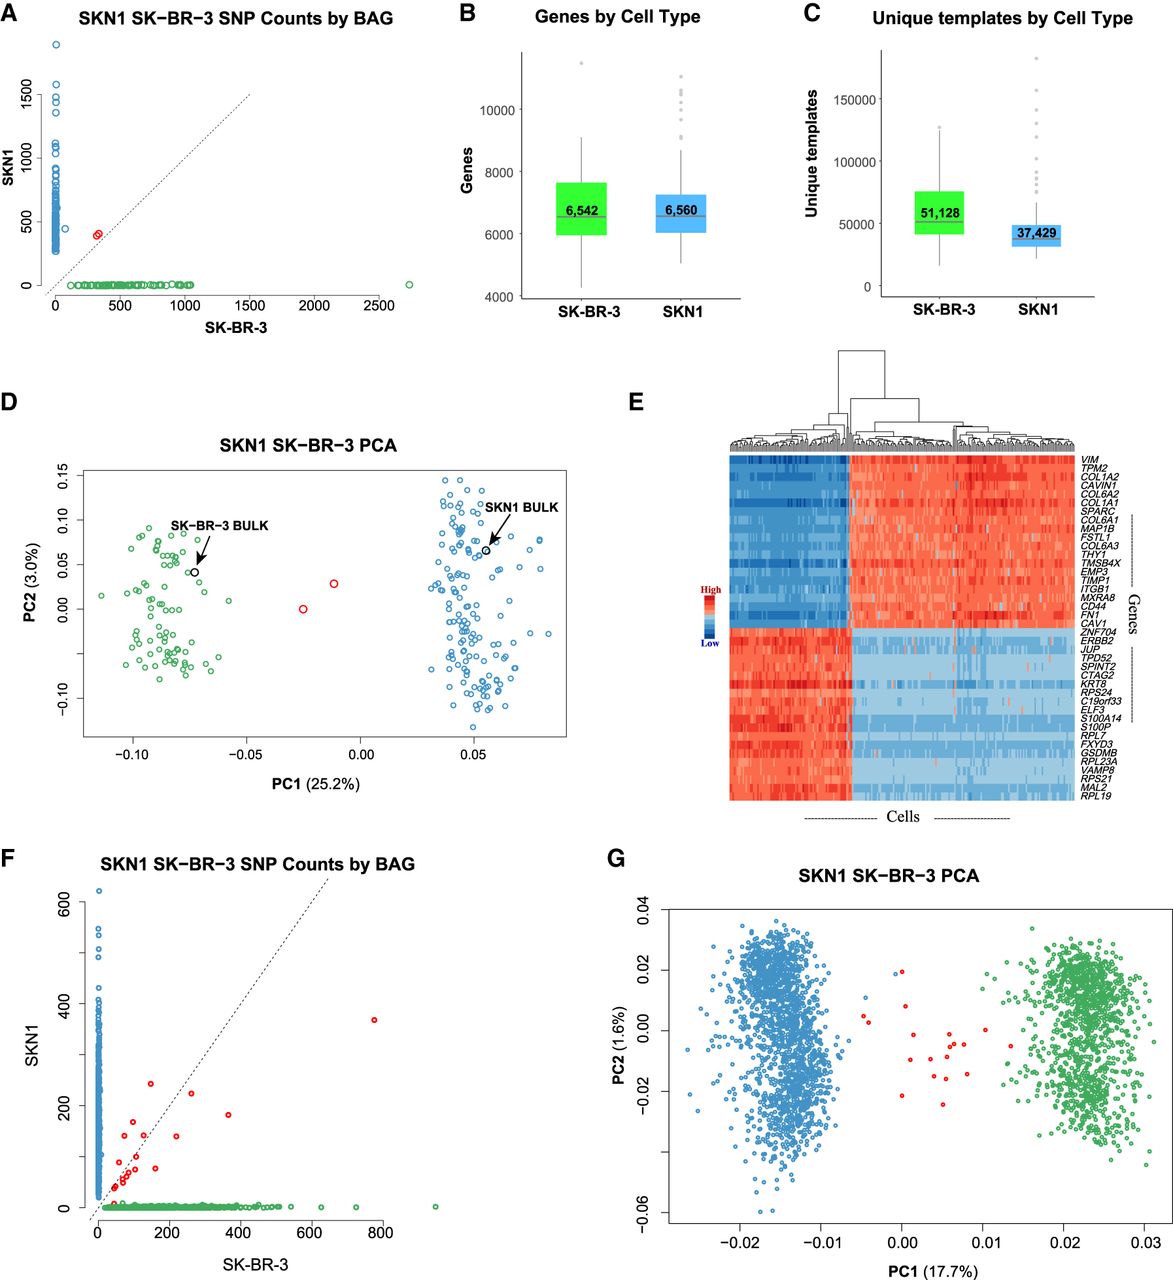
Single-cell RNA (scRNA) BAG showing high yield, low contamination, and consistent expression profiles. (A–E) A two-cycle split-pool experiment including 235 cells. (F,G) A three-cycle split-pool experiment including 2875 cells. (A) Scatter plot showing the number of SKN1-specific and SK-BR-3–specific SNVs found in exons for each cell. BAGs with majority SKN1 or SK-BR-3 SNVs are colored blue or green. Two (0.85% of total) BAGs without clear majority SNVs are labeled as red. (B) Boxplot showing the number of genes detected per cell. (C) Boxplot showing the number of unique templates captured per cell. (D) Scatter plot of PC1 versus PC2. The scRNA BAGs are colored by their majority SNVs defined in A. Two bulk RNA data sets for SKN1 and SK-BR-3 clusters with their respective single-cell data. The contribution of PC1 is more than eight times that of PC2 (25.2%/3.0%). (E) Heatmap based on 40 (20+, 20−) genes with the most positive and negative correlations to PC1. (F) Scatter plot showing the number of SKN1-specific and SK-BR-3–specific SNVs found in exons for each cell in the three-cycle split-pool experiments. Nineteen (0.66% of total) cells without clear majority SNVs are labeled as red. (G) PC1 versus PC2 from the 2875 cells in the three-cycle split-pool experiment illustrated in F.


