
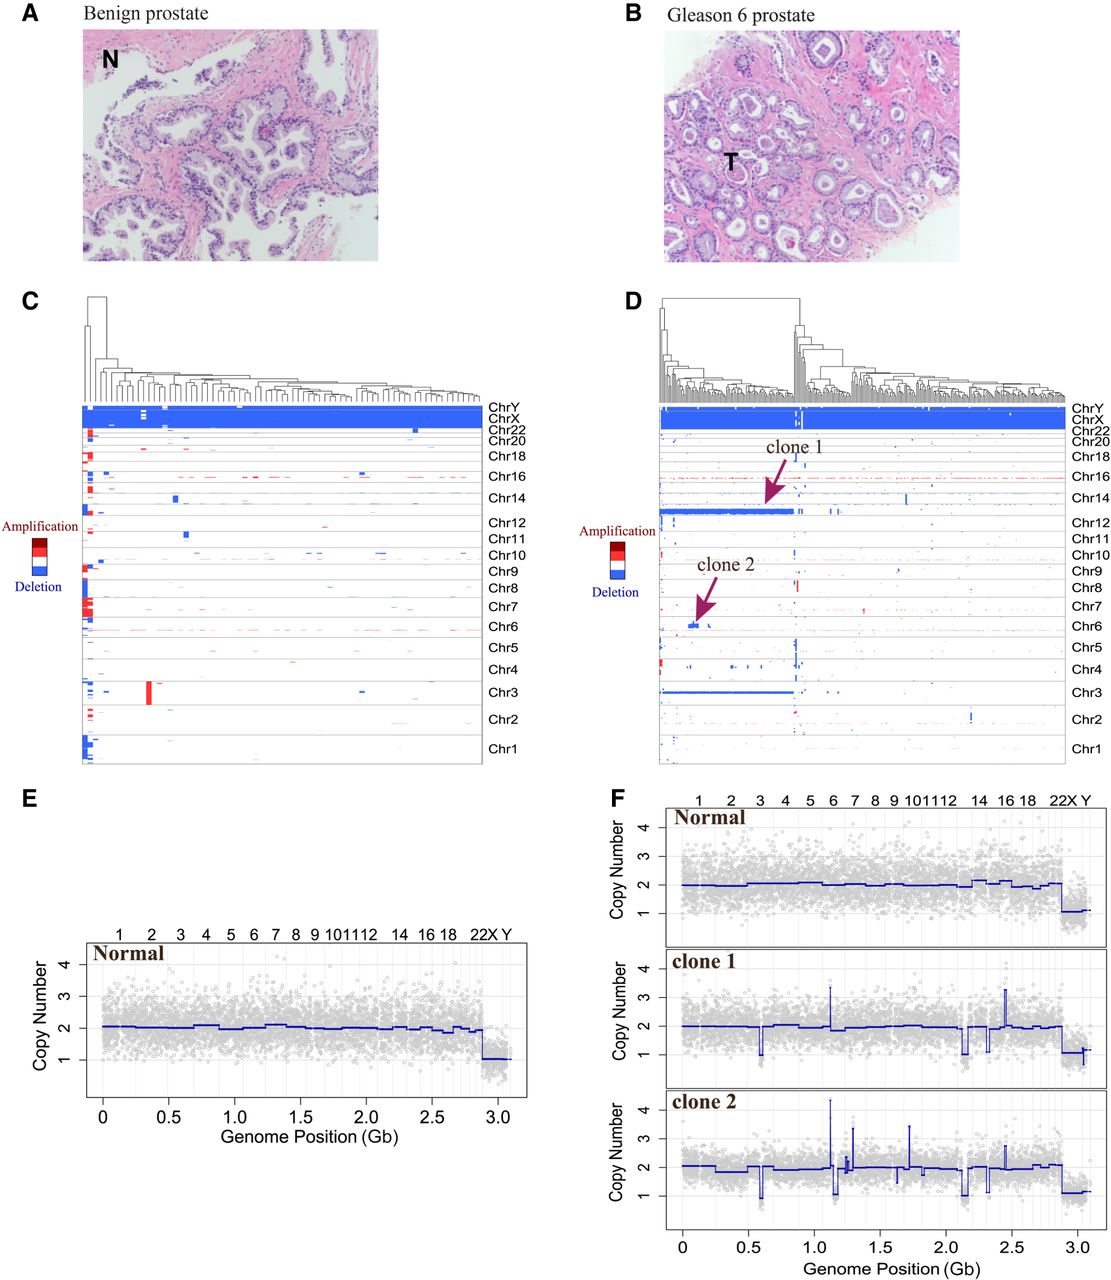
CNV study of prostate tumor biopsy wash samples from a benign region and a Gleason 6 cancer region. (A) A 20× magnification pathology image of a benign region of the prostate. (B) Pathology image of a Gleason 6 cancer region from the same patient at the same resolution. (C) Hierarchical clustering of biopsy wash sample from the benign region. (D) Hierarchical clustering of biopsy wash sample from the Gleason 6 region showing a normal clone and two tumor clones based on CNV patterns. Red arrows indicate the major (clone 1) and minor (clone 2) tumor clones. (E) A representative normal single-nucleus copy number profile from the biopsy wash of this benign region. (F) Representative single-nucleus copy number profiles from one normal clone and two tumor clones from the biopsy wash of the Gleason 6 cancer region.


