
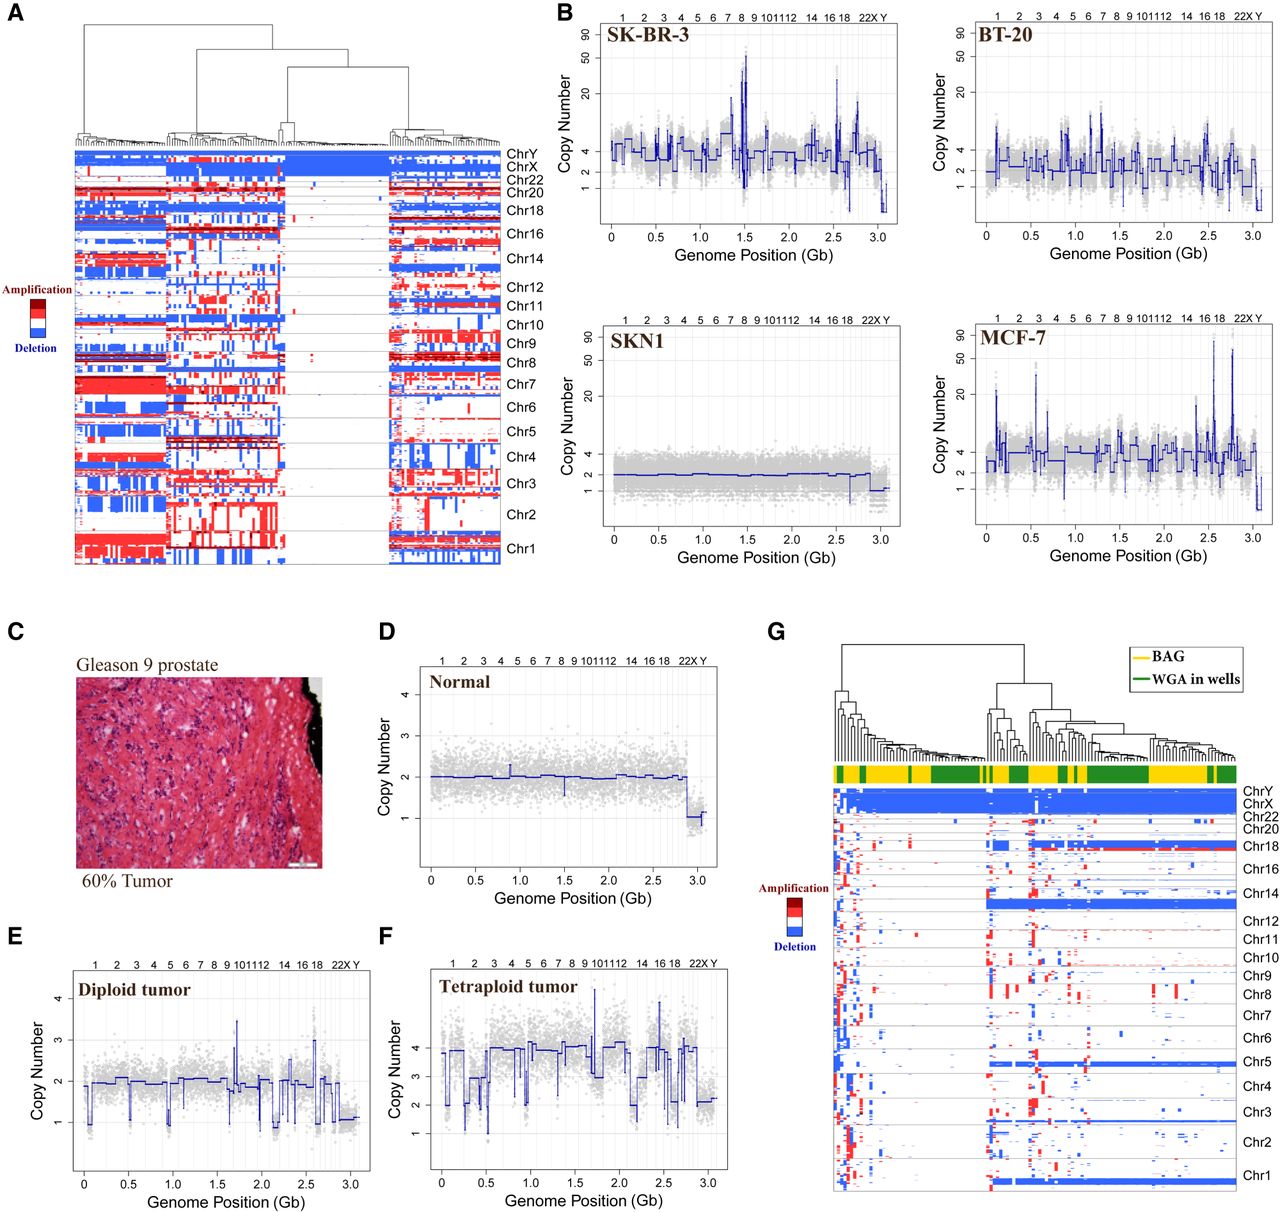
Copy number variation analysis of single-nucleus DNA (snDNA) BAG in cell lines and frozen prostate tumor. (A) Hierarchical clustering of four cell types SKN1, SK-BR-3, MCF-7, and BT-20 at a resolution of 20,000 bins (150 kbp per bin). Red indicates amplification, whereas blue indicates deletion. (B) The 20,000-bin copy number profiles from each of the four clusters in A. (C) Pathology image showing the region of Gleason 9 prostate cancer, which was estimated by pathologist as 60% tumor. Scale bar, 100 µm. (D–F) Representative snDNA BAG copy number profiles from this region: (D) a representative normal copy number profile; (E) a representative diploid tumor profile; and (F) a representative tetraploid tumor profile. (G) Hierarchical clustering of this region by combining data from both the BAG method and 96-well WGA method.


