
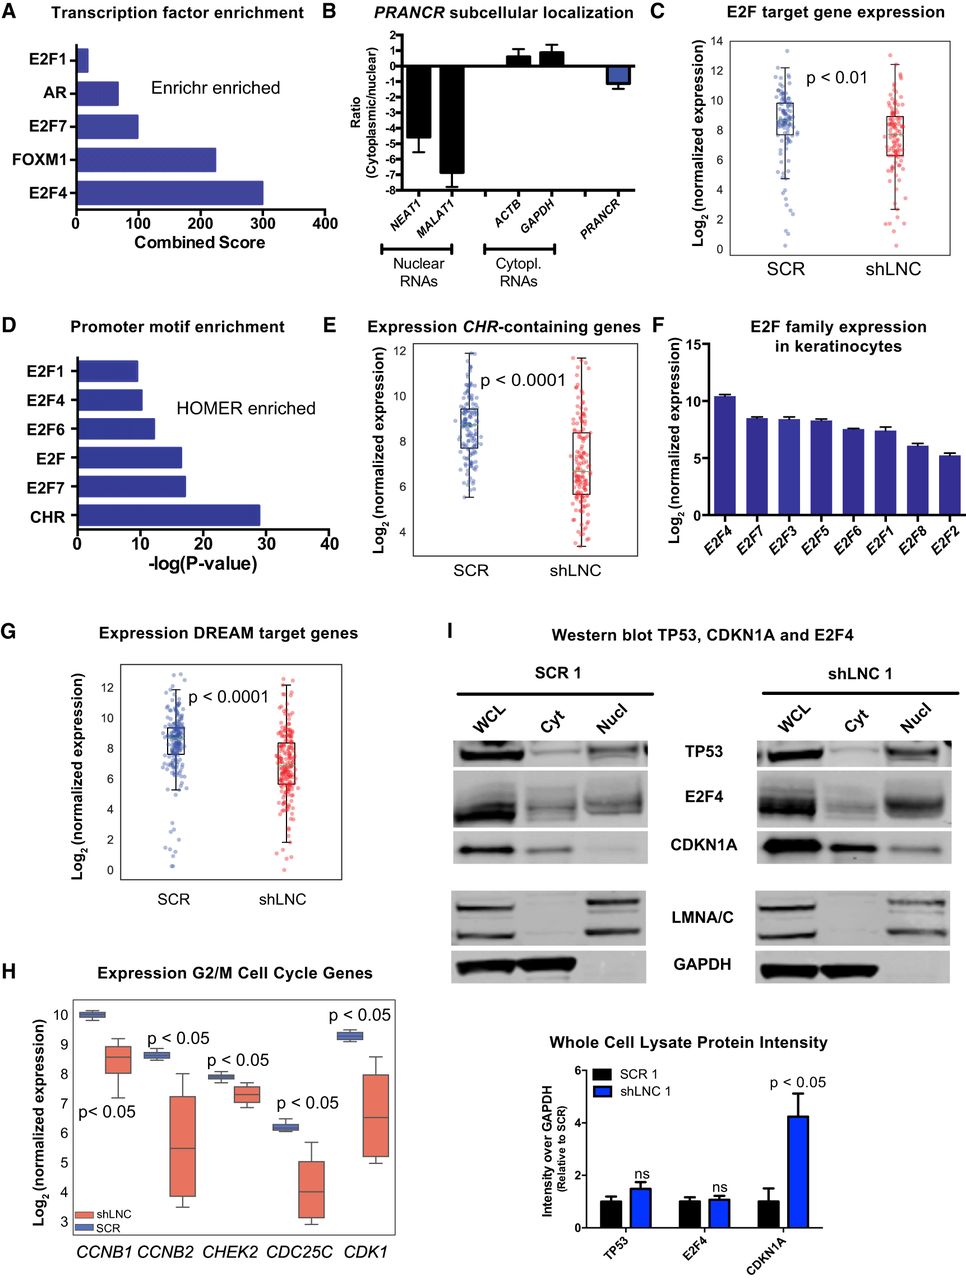
PRANCR regulates expression of cell cycle genes containing the CHR promoter element. (A) Combined score of transcription factor enrichment of genes down-regulated upon PRANCR depletion using Enrichr gene set enrichment analysis. (B) PRANCR mRNA expression in cytoplasmic and nuclear cell fractions, measured by qRT-PCR, compared with known cytoplasmic (ACTB and GAPDH) and nuclear RNAs (NEAT1 and MALAT1). Bars, mean with SEM; n = 4 cell lines. (C) Normalized expression of E2F target genes. For box plots, dots represent mean expression level (n = 4) of each gene, lines represent median values of the gene set, box limits denote interquartile range, and whiskers extend 1.5 times the interquartile range. Differences evaluated with Student's t-test. (D) Motif enrichment of down-regulated DEGs using HOMER. (E) Normalized expression of genes containing a CHR promoter element. (F) Normalized expression of E2F family members in primary keratinocytes (n = 4; mean with SD). (G) Normalized expression of DREAM target genes. (H) Normalized expression of G2/M genes. (I) Western blot of TP53, E2F4, and CDKN1A in whole-cell lysate, cytoplasmic (Cyt), and nuclear (Nucl) fractions in control (SCR) and PRANCR-depleted cells (shLNC1). LMNA/C (nuclear) and GAPDH (cytoplasmic) represent experimental fractionation controls. Lower panel shows quantification of results by densitometry after normalization of total protein levels and represents the average of three biological replicates (Supplemental Fig. S6). Results evaluated with paired Student's t-test.


