
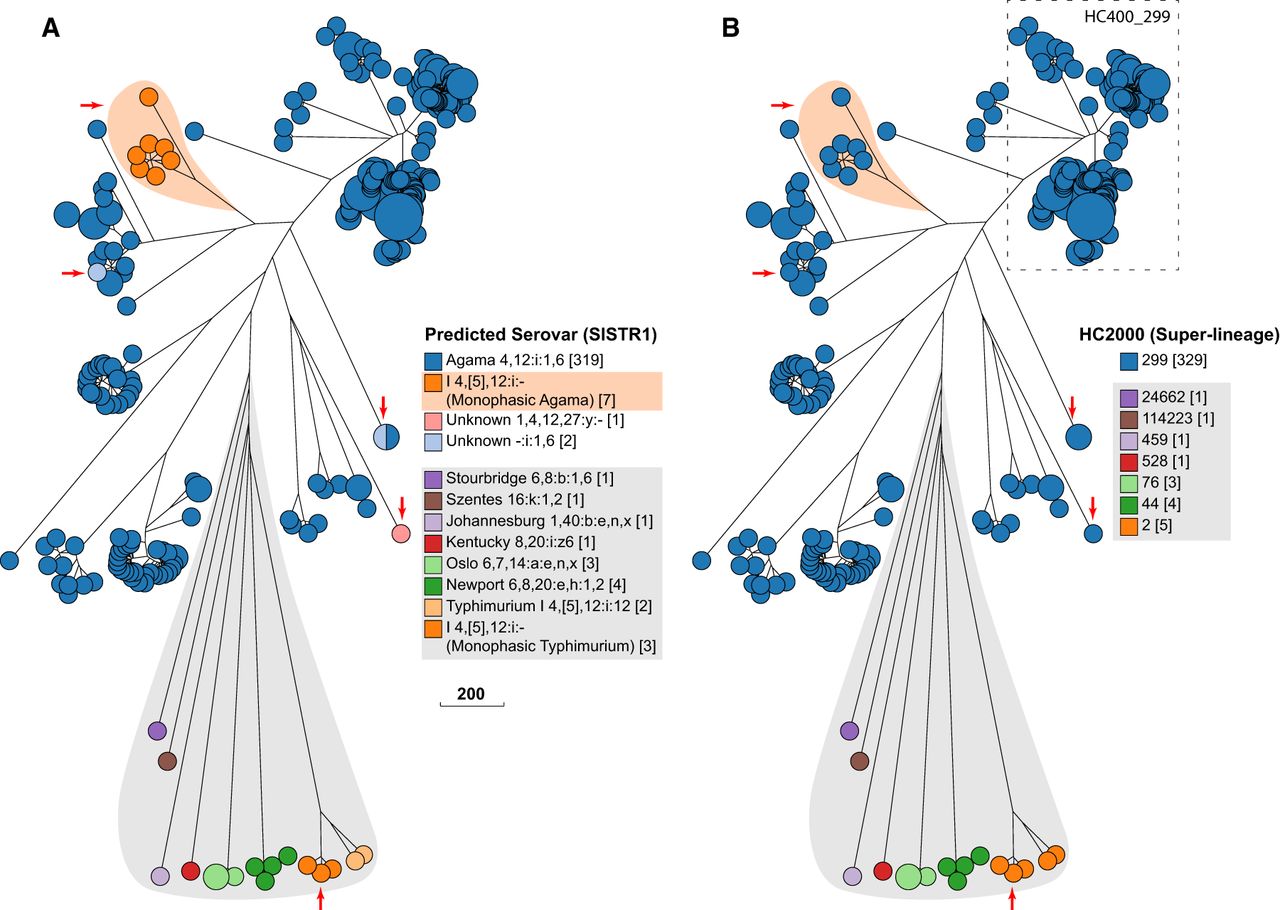
Serovar versus HierCC clustering in serovar Agama. GrapeTree (Zhou et al. 2018a) depiction of a RapidNJ tree (Simonsen et al. 2011) of cgMLST allelic distances between genomic entries whose metadata Serovar field contained Agama or SISTR1 (Robertson et al. 2018) Serovar predictions contained Agama. (A) Color coding by Predicted Serovar (SISTR1). Arrows indicate isolates whose serovar was not predicted. Orange shading emphasizes 1,4,[5],12:i:- isolates that were monophasic Agama. Gray shading indicates isolates with incorrect Serovar metadata, including 1,4,[5],12:i:- isolates that were monophasic Typhimurium (arrow). (B) Color coding by HC2000 cluster. All Agama entries are HC2000_299, as were the genetically related entries marked with arrows or emphasized by orange shading. Entries from other serovars (gray shading) were in other diverse HC2000 clusters. The dashed box indicates a subset of Agama strains within HC400_299, including all isolates from badgers, which were chosen for deeper analyses in Figure 4. (Scale bar) Number of cgMLST allelic differences.


