
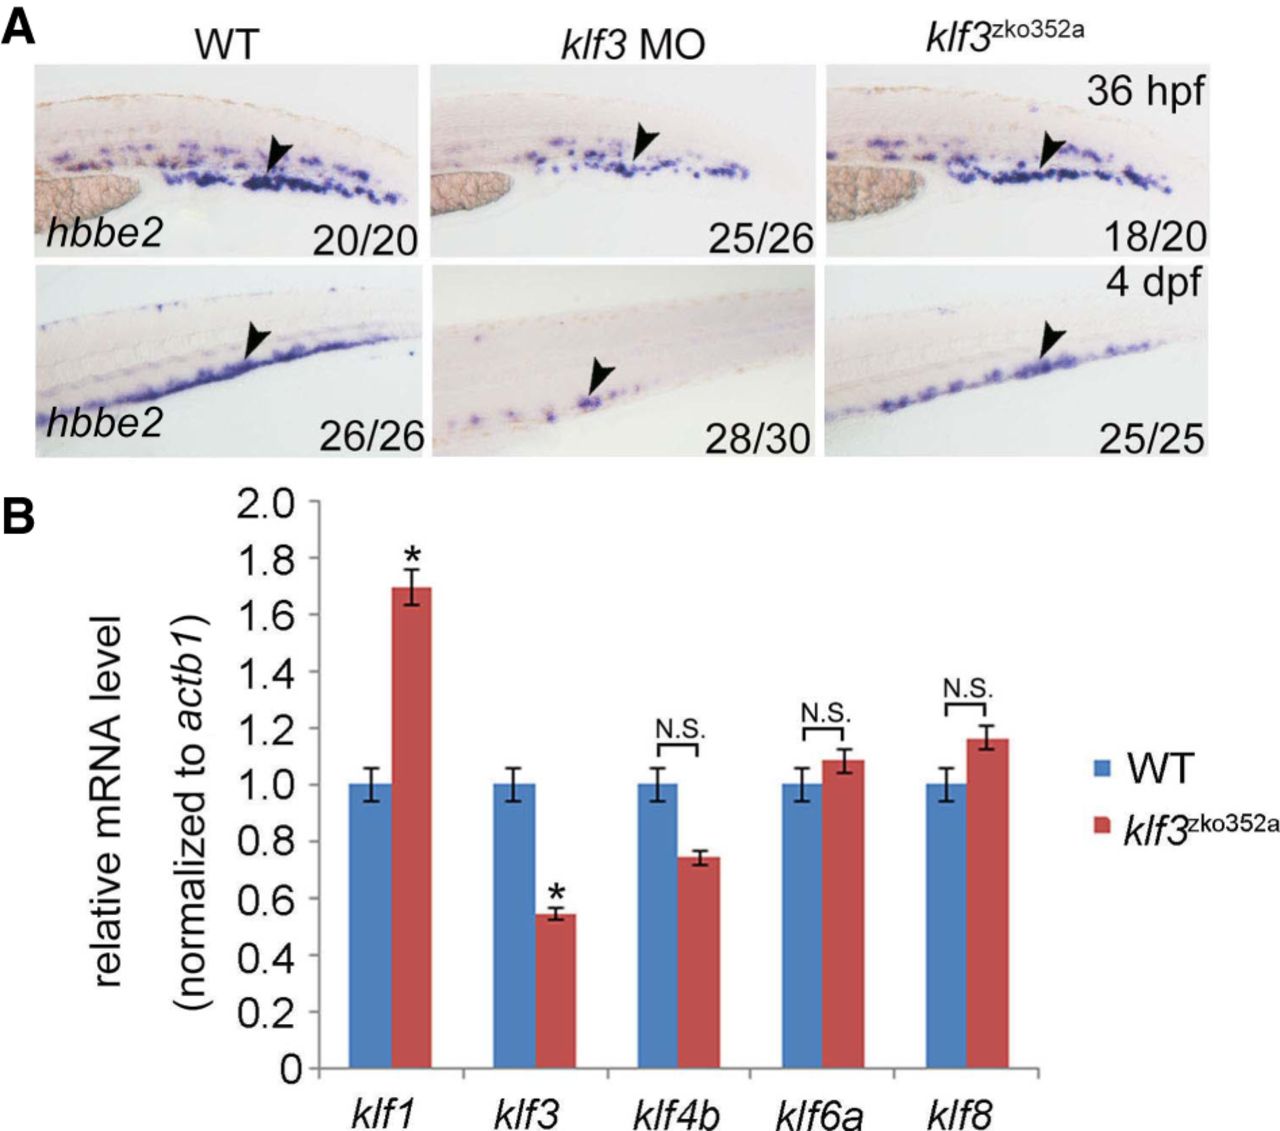
Figure 4.
Phenotypic comparison between klf3 mutants and morphants. (A) WISH showing the expression of hbbe2 (also known as βe2-globin) in klf3 WT, morphants, and mutants. The black arrowheads indicate hbbe2 expression in erythroid lineages. (B) Quantitative real-time PCR showing the expression of Klf members klf1, klf3, klf4b, klf6a, and klf8 in klf3 mutants.


