
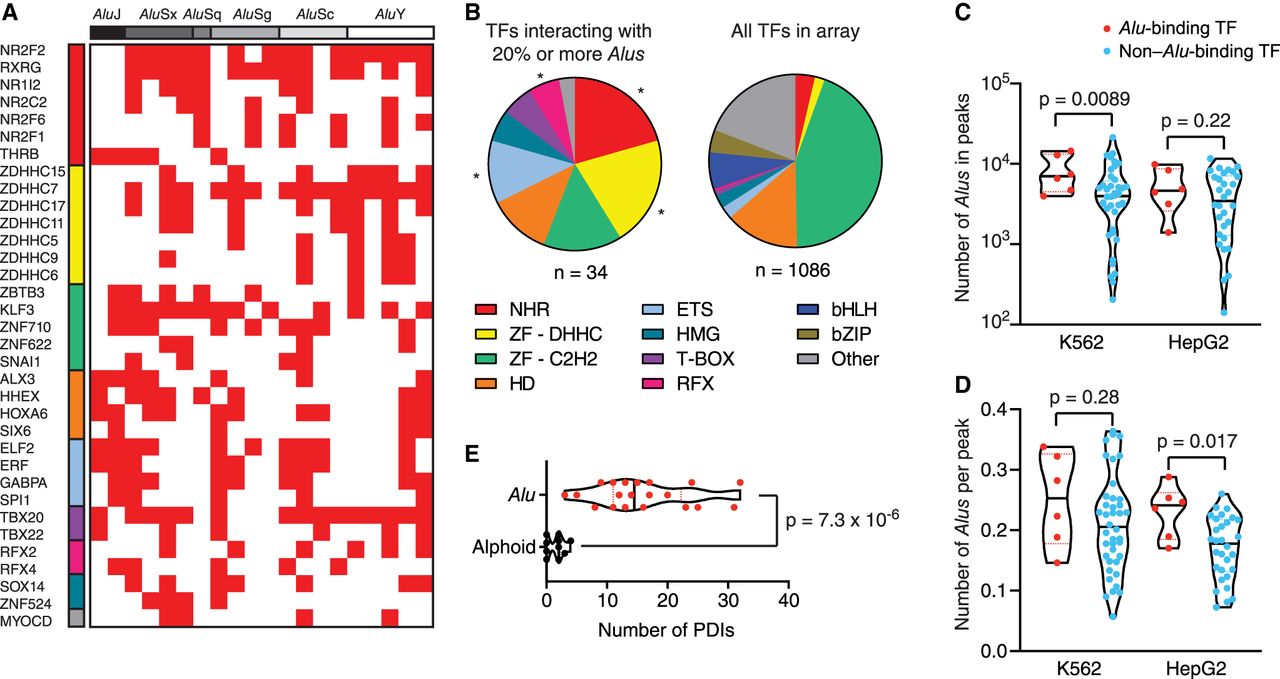
Identification of TFs that interact with Alu sequences. (A) TFs that interact with 20% or more of the Alu sequences tested were identified using eY1H assays. TFs and Alu sequences are ordered by family. (B) Distribution by family for TFs that interact with at least 20% of the Alu sequences tested, compared to the distribution of TFs in the eY1H array. (NHR) nuclear hormone receptor, (ZF-DHHC) zinc finger DHHC, (ZF-C2H2) zinc finger Cys2His2, (HD) homeodomain, (ETS) E26 transformation-specific, (HMG) high mobility group, (RFX) regulatory factor X, (bHLH) basic helix-loop-helix, (bZIP) basic leucine zipper domain. (*) P < 0.05 by proportion comparison test after Bonferroni correction. (C,D) The number of Alu sequences in ChIP-seq peaks (C) and the average number of Alu sequences per peak (D) are plotted for TFs that bind at least 20% of Alu sequences by eY1H assays (red) and TFs for which we did not detect binding to Alu sequences (blue). ChIP-seq data was obtained from the ENCODE Project for the K562 and HepG2 cell lines. Violin plots are shown, and the median is indicated by a solid black line. Statistical significance determined by two-tailed Student's t-test with Welch's correction for unequal variances. (E) Comparison between the number of protein-DNA interactions (PDIs) detected per element for Alu and alphoid sequences. Violin plots are shown, and the median is indicated by a solid black line. Statistical significance determined by two-tailed Mann–Whitney U test.


