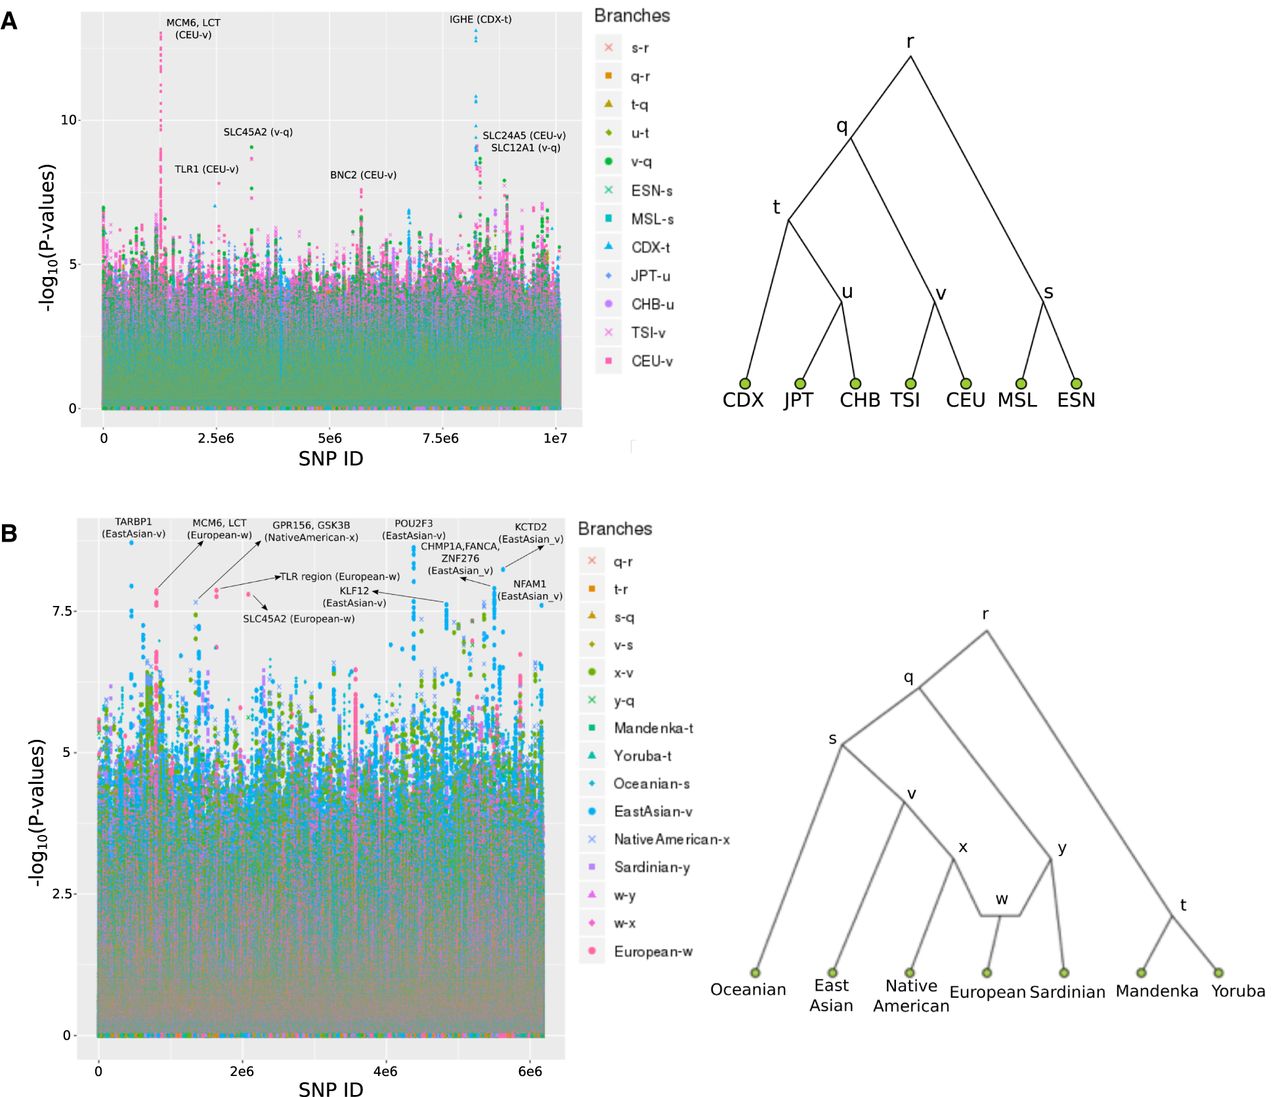
Identifying loci under positive selection in complex population histories

(Downloading may take up to 30 seconds. If the slide opens in your browser, select File -> Save As to save it.)

Click on image to view larger version.

Figure 4.
Figure 4.

We ran GRoSS on human genomic data. (A) Population tree including panels from phase 3 of the 1000 Genomes Project. (B) Population graph including imputed panels from the Human Origins SNP capture data from Lazaridis et al. (2014).

This Article

  1. Genome Res. 29: 1506-1520

Preprint Server