
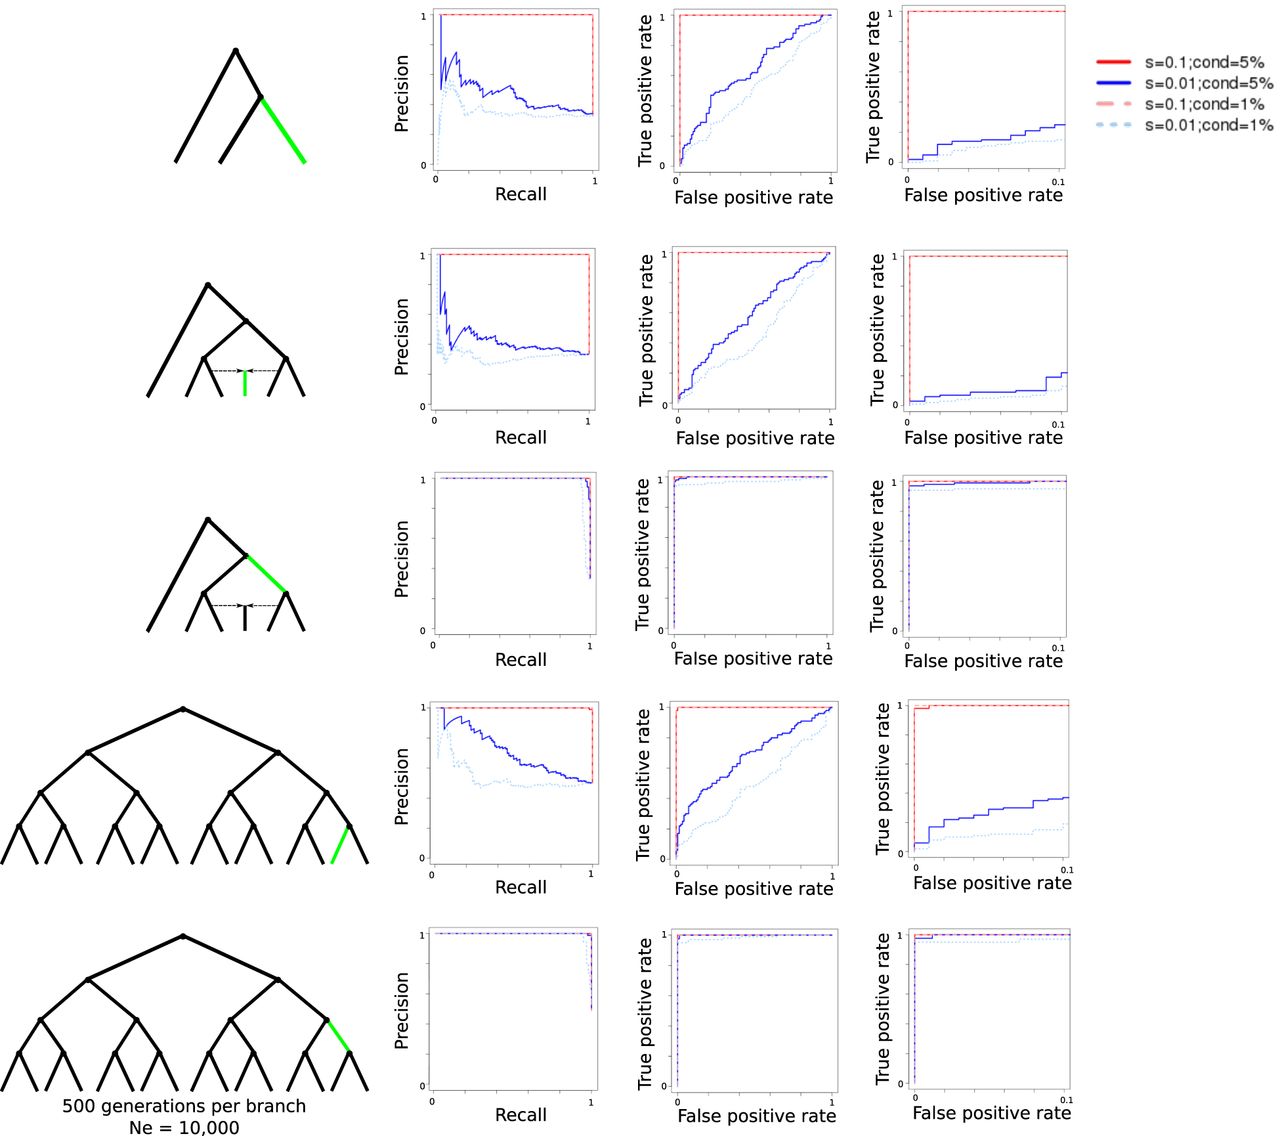
Figure 3.
Evaluation of GRoSS performance using simulations in SLiM 2, with 100 diploid individuals per population panel. We produced precision-recall (left) and ROC (center and right) curves comparing simulations under selection to simulations under neutrality for a three-population tree, a six-population graph with a 50%/50% admixture event, and a 16-population tree. The right-most ROC curves are a zoomed-in version of the center ROC curves, in which the false-positive rate is limited to be equal to or less than 0.1.


