
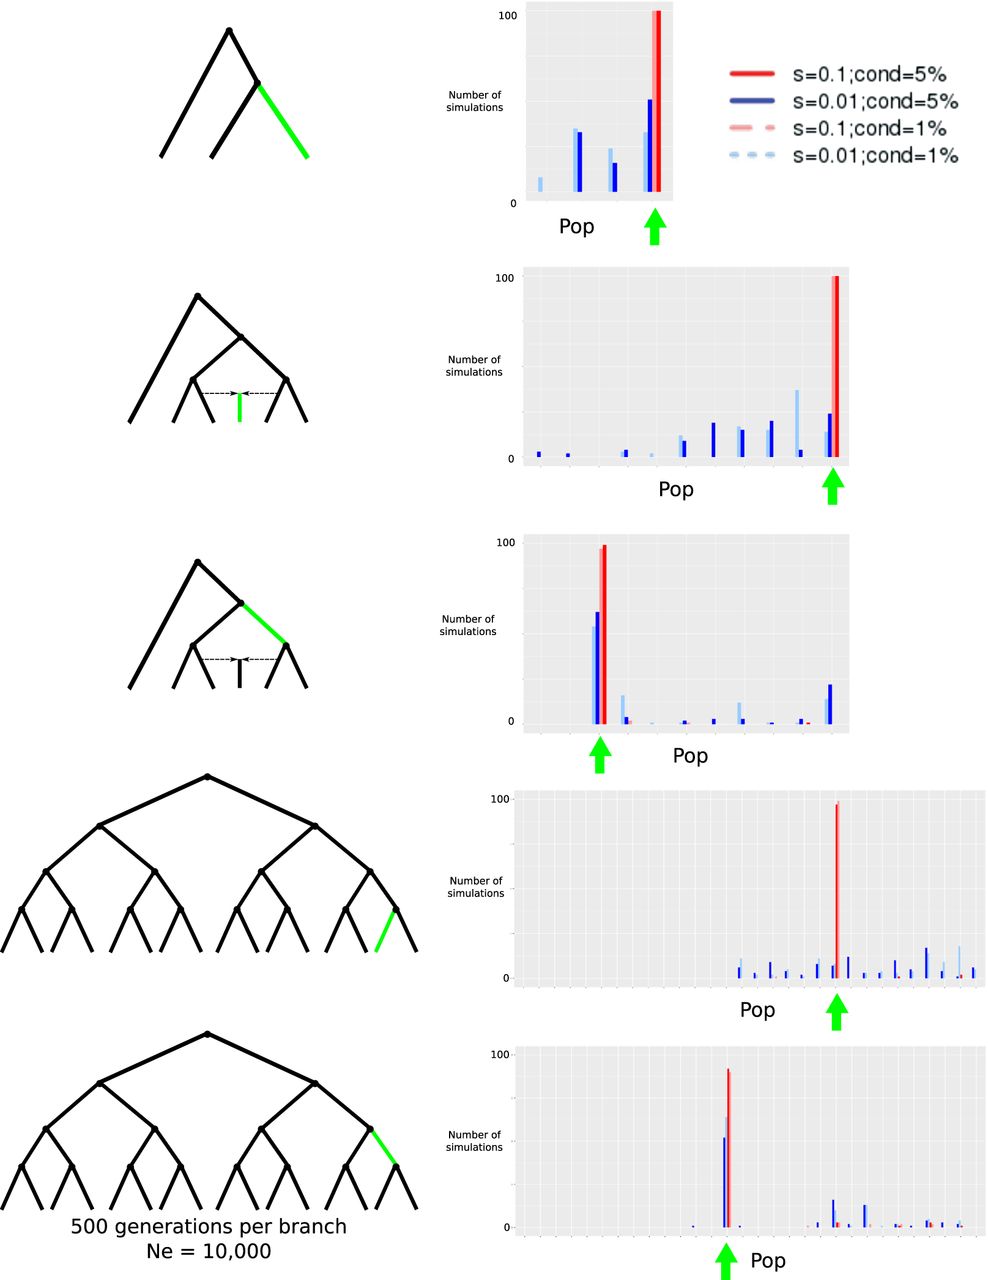
Evaluation of GRoSS performance using simulations in SLiM 2, with 100 diploid individuals per population panel. We simulated different selective sweeps under strong (s = 0.1) and intermediate (s = 0.01) selection coefficients for a three-population tree, a six-population graph with a 50%/50% admixture event, and a 16-population tree. We obtained the maximum branch score within 100 kb of the selected site and computed the number of simulations (out of 100) in which the branch of this score corresponded to the true branch in which the selected mutation arose (highlighted in green). (cond = 5%) Simulations conditional on the beneficial mutation reaching 5% frequency or more; (cond = 1%) simulations conditional on the beneficial mutation reaching 1% frequency or more; (Pop) population branch. The green arrow denotes the values of the statistic corresponding to the branch in which the selected mutation arose.


