
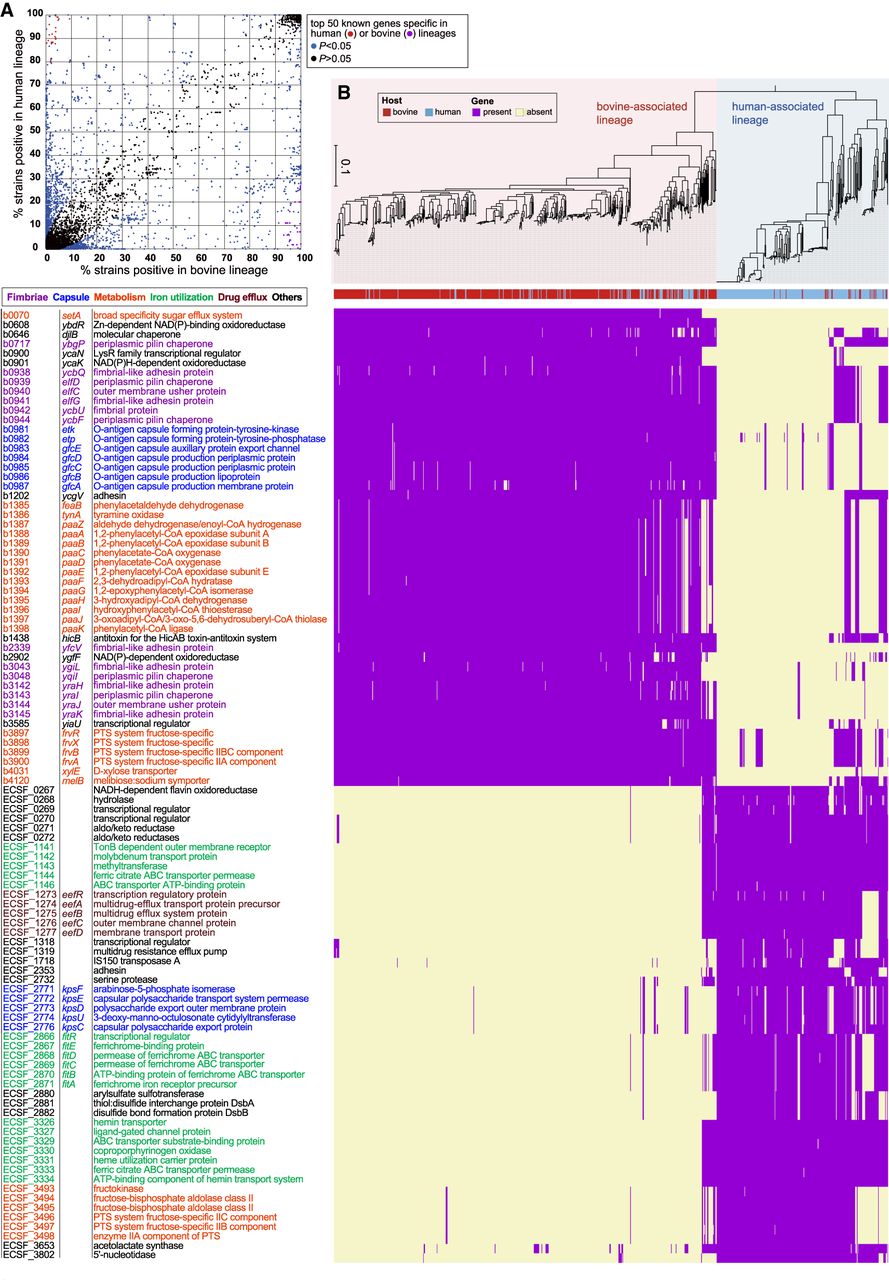
Bovine- or human-associated lineage-specific gene. (A) A scattered plot of gene conservation in the bovine- and human-associated lineages. Genes that were significantly (positively or negatively) associated with the bovine-associated lineage (Bonferroni P < 0.05) are indicated by blue dots. Among the positively associated (bovine-associated lineage-specific) and negatively associated (human-associated lineage-specific) genes, the top 50 genes with known or predictable functions (Bonferroni P < 1 × 10−135 and P < 1 × 10−141, respectively) are indicated in each group by purple and red dots, respectively. (B) Distribution of the bovine- or human-associated lineage-specific genes in the core gene–based ML tree (the same tree shown in Fig. 2). Presence and absence of each gene are indicated by purple and beige, respectively.


