
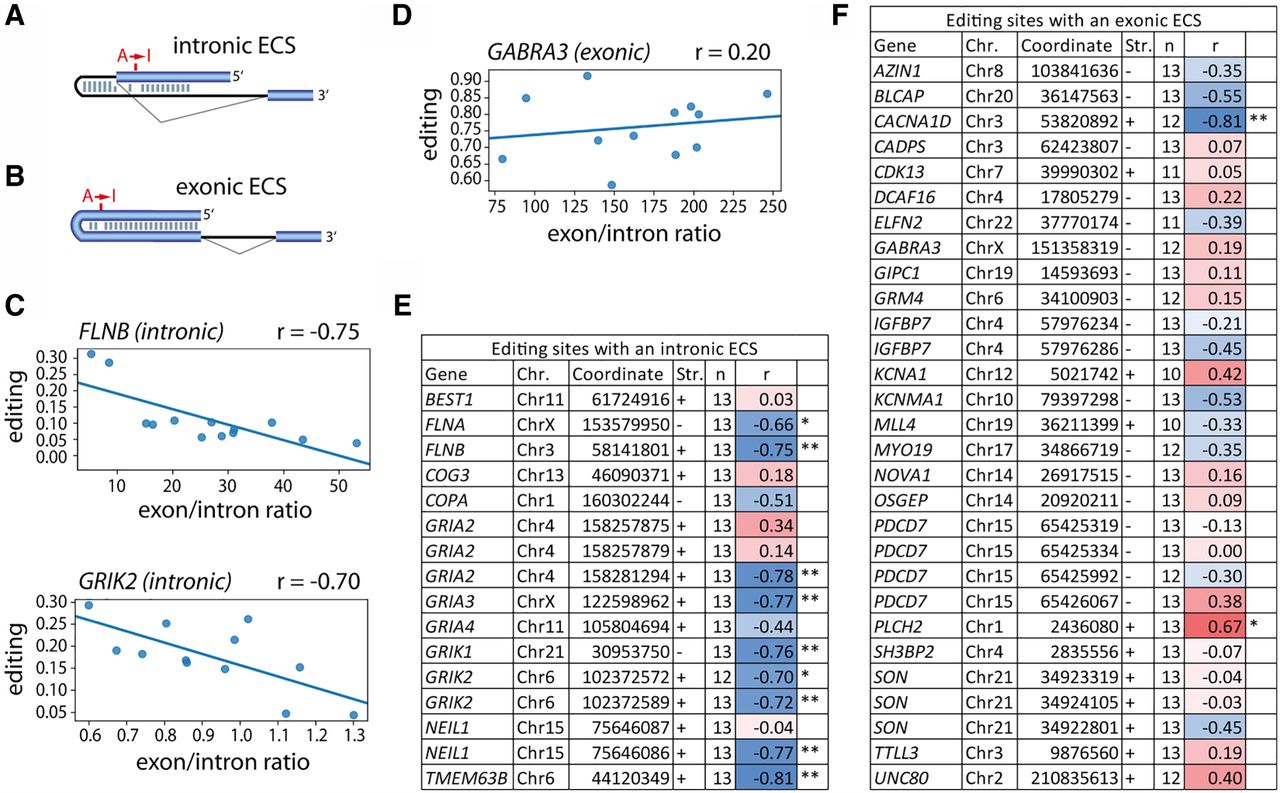
Splicing controls tissue-specific A-to-I editing for intron-dependent sites. (A,B) Exonic editing sites either depend on an (A) intronic editing complementary site (intronic ECS) or (B) exonic ECS. Exons are shown as blue bars, introns as thin lines. The editing site (A → I) is depicted. (C,D) Representative graphs for the correlation between average editing level and average exon/intron coverage at the downstream intron (as a measure of splicing efficiency) are shown for sites with a (C) intronic ECS like FLNB and GRIK2 or (D) exonic ECS like GABRA3 across different brain regions (RNA-seq data from GTEx). (E,F) The correlation (r = Pearson correlation coefficient) between average editing levels and average exon/intron ratio for conserved editing sites (Coordinates: hg19; [Chr.] chromosome; [Str.] strand) is plotted when the read coverage allowed calculation of editing levels and exon/intron ratio for at least 10 tissues (n = number of tissues) with minimum of two samples. Color code ranges from blue = strong negative correlation over white = no correlation to red = positive correlation. The significance is indicated by one or two asterisks: (*) P-value < 0.05, (**) P-value < 0.01.


