
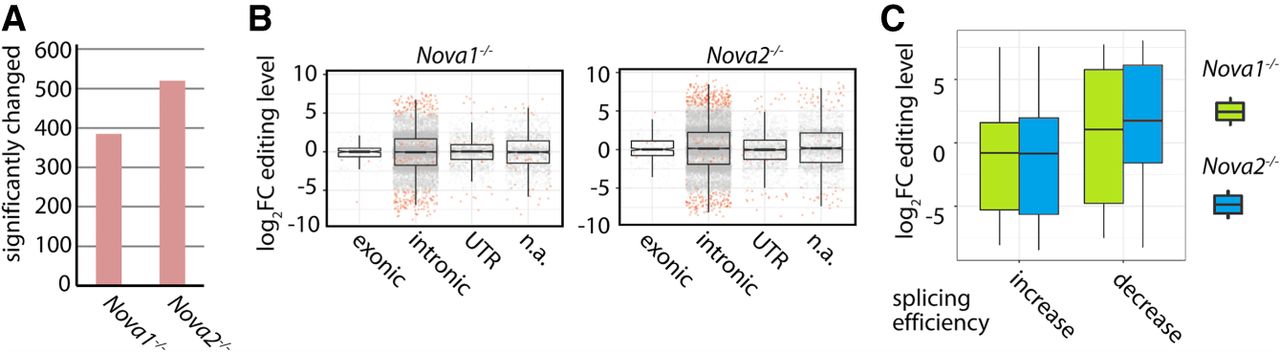
The alternative splicing factors NOVA1 and NOVA2 modulate editing levels. (A) Re-analysis of publicly available RNA-seq data from the cortices of six wild-type and three Nova1−/− and three Nova2−/− mice (Saito et al. 2016). The reads have been mapped to the mouse genome (mm10), and the editing level of known editing sites was determined. The total number of significantly changed editing sites is given (P-value < 0.05). (B) Editing levels in cortices of wild-type and either Nova1−/− (left panel) or Nova2−/− (right panel) knockout mice were determined, and the change in editing levels was plotted. Dots represent single editing sites. Significantly changed sites are highlighted in red (P-value < 0.05). A separate box plot is given for different genic locations (exonic, intronic, UTR, [n.a.] not annotated/intergenic). (C) Box plot showing the log2 fold change of editing levels for editing sites with up-regulated splicing efficiency (increase) or down-regulated splicing efficiency (decrease) for wild-type versus Nova1−/− (green) or wild-type versus Nova2−/− (blue) mice. Splicing efficiency is determined by a decrease (up-regulated splicing efficiency) or increase in intron-specific coverage (down-regulated splicing efficiency) as determined by DEXSeq (P-value < 0.1).


