
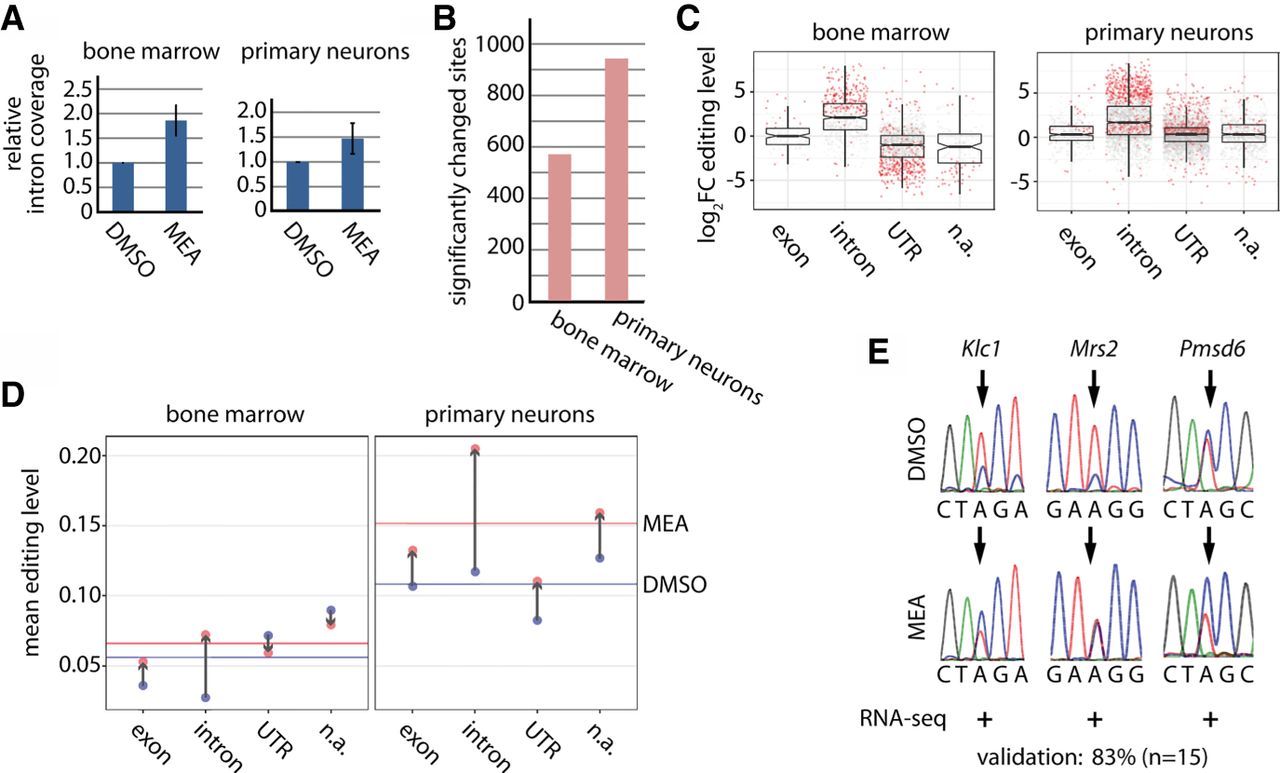
Reduced splicing efficiency globally increases exonic and intronic editing. (A) Either bone marrow cells or primary neurons were treated with the splicing inhibitor meayamcyin (MEA) or vehicle control (DMSO). RNA was isolated after treatment, and poly(A)-selected RNA was subjected to RNA-seq. The relative intronic coverage over editing sites after treatment with MEA is shown. Bone marrow: n = 6, primary neurons: n = 5, error bars = SEM. (B) Bar plot displaying the overall number of significantly changed editing sites for bone marrow and primary neurons. (C) Box plots showing the log2 fold change (log2FC) for editing levels in untreated (DMSO) and treated (MEA) primary cells (bone marrow: left panel, primary neurons: right panel) separated into different genic locations (exonic, intronic, UTR, [n.a.] not annotated, i.e., intergenic). Dots represent single editing sites. Significantly changed sites are highlighted in red (P-value < 0.05). (D) Mean editing levels in bone marrow (left panel) or primary neurons (right panel) for grouped editing sites (intron, exon, UTR, n.a.) under DMSO conditions (blue dots) or meayamycin treatment (red dots). The blue (DMSO) or red (meayamycin) line is drawn at the mean editing level of all sites. Gray arrows indicate the shift in mean editing levels upon meayamycin treatment. (E) Validation of changed editing levels by Sanger sequencing. The editing site is marked by an arrow. The change in editing determined by RNA-seq is given below the chromatograms (+ or − indicates an increase or decrease upon treatment as determined by RNA-seq).


