
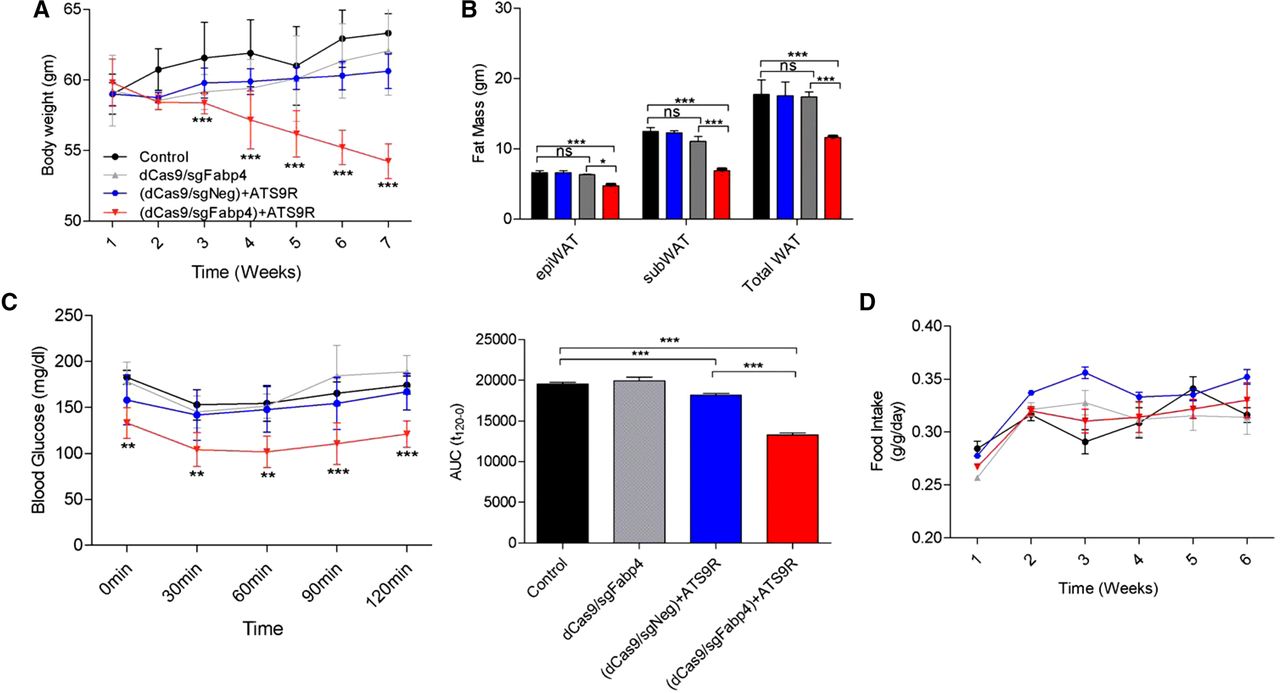
Figure 6.
CRISPRi repression of Fabp4 in a high-fat diet-induced mouse model. (A) Weekly body weight. (B) Fat masses for epiWAT, subWAT, and total white adipose tissue. (C) Insulin tolerance test after 6 wk of treatment. Insulin was injected intraperitoneally and blood glucose was detected at each time point, and AUC was determined. (D) Weekly food intake. Data are presented as mean ± SEM (n = 3–5). (ns) nonsignificant, (*) P < 0.05, (**) P < 0.01, (***) P < 0.001 was considered significant.


