
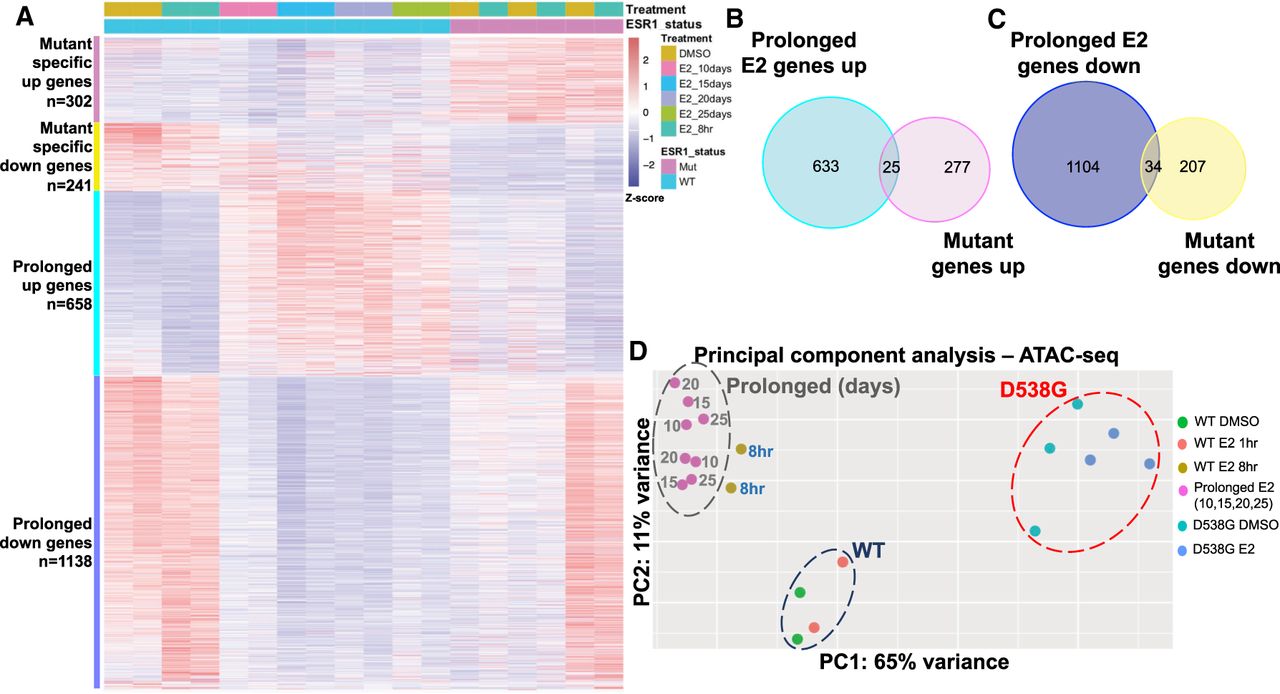
Prolonged E2 exposure does not recapitulate D538G mutant regulatory consequences. (A) Heatmap shows the relative expression of mutant-specific differentially expressed genes as well as genes up- and down-regulated in response to prolonged E2 (each row is a gene). Samples are indicated by the column annotations described in the legend. (B) Venn diagram shows the overlap between genes up-regulated in wild-type lines exposed to prolonged E2 and mutant-specific up-regulated genes. (C) Venn diagram shows the overlap between genes down-regulated in wild-type lines exposed to prolonged E2 and mutant-specific down-regulated genes. (D) Principal component analysis of ATAC-seq signal exhibits three sample groups: wild-type lines with 1-h or no E2 treatment (navy circle), wild-type lines with prolonged E2 exposure (gray circle, numbers indicate days of treatment), and D538G mutant lines (red circle).


