
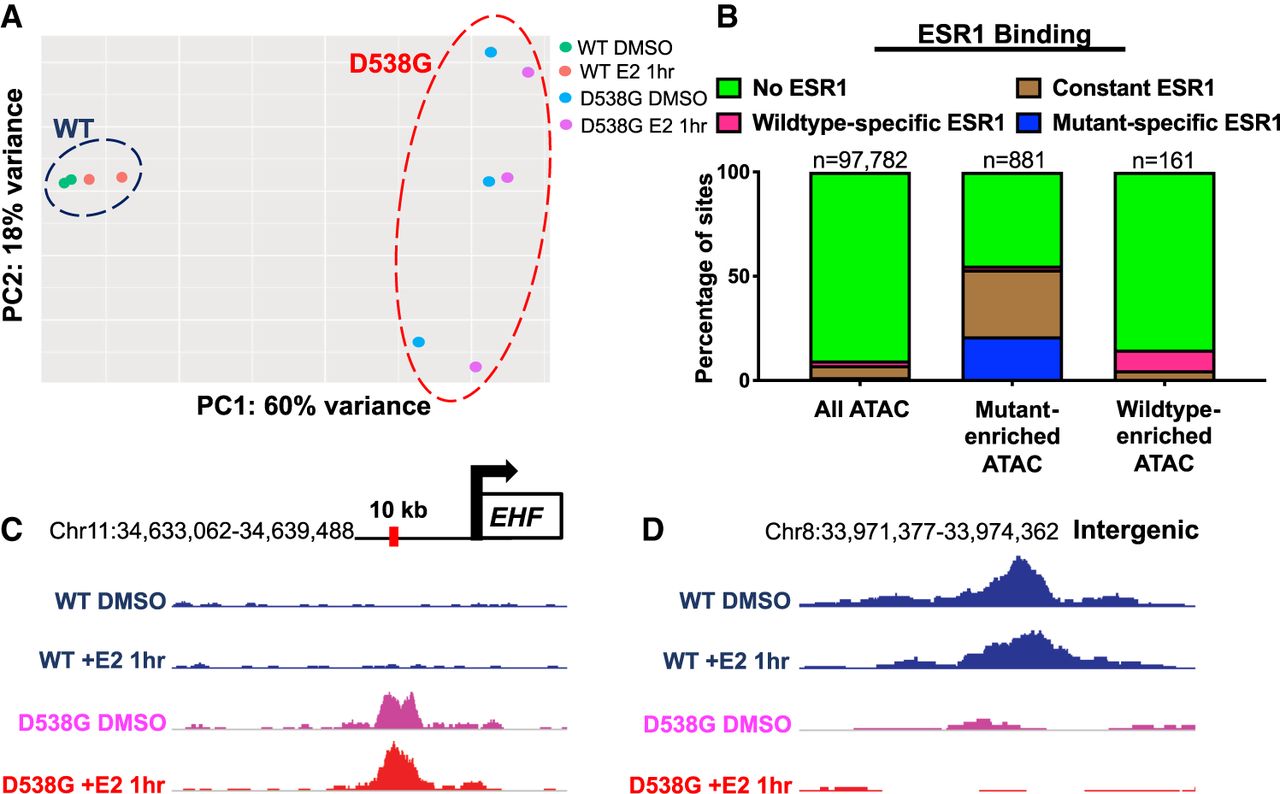
ESR1 D538G mutation alters chromatin accessibility at multiple loci. (A) Principal component analysis shows the relationship between ATAC-seq signal of ESR1 wild-type (blue circle) and D538G mutant cell lines (red circle). (B) Less than 10% of all ATAC-seq sites overlap with ESR1 binding sites, whereas 55% of mutant-enriched ATAC-seq sites overlap ESR1 binding sites, including constant ESR1 binding (brown) and mutant-enriched ESR1 binding (blue). Fifteen percent of wild-type–enriched ATAC-seq sites overlap ESR1 binding sites. Representative browser tracks show ATAC-seq signal increases with the D538G mutation at a region near EHF (C) and ATAC-seq signal decreases at an intergenic region on Chromosome 8 (D). Wild-type ATAC-seq signal DMSO/+E2 (blue), D538G DMSO (pink), and D538G + E2 (red) are scaled to the same value at each locus.


