
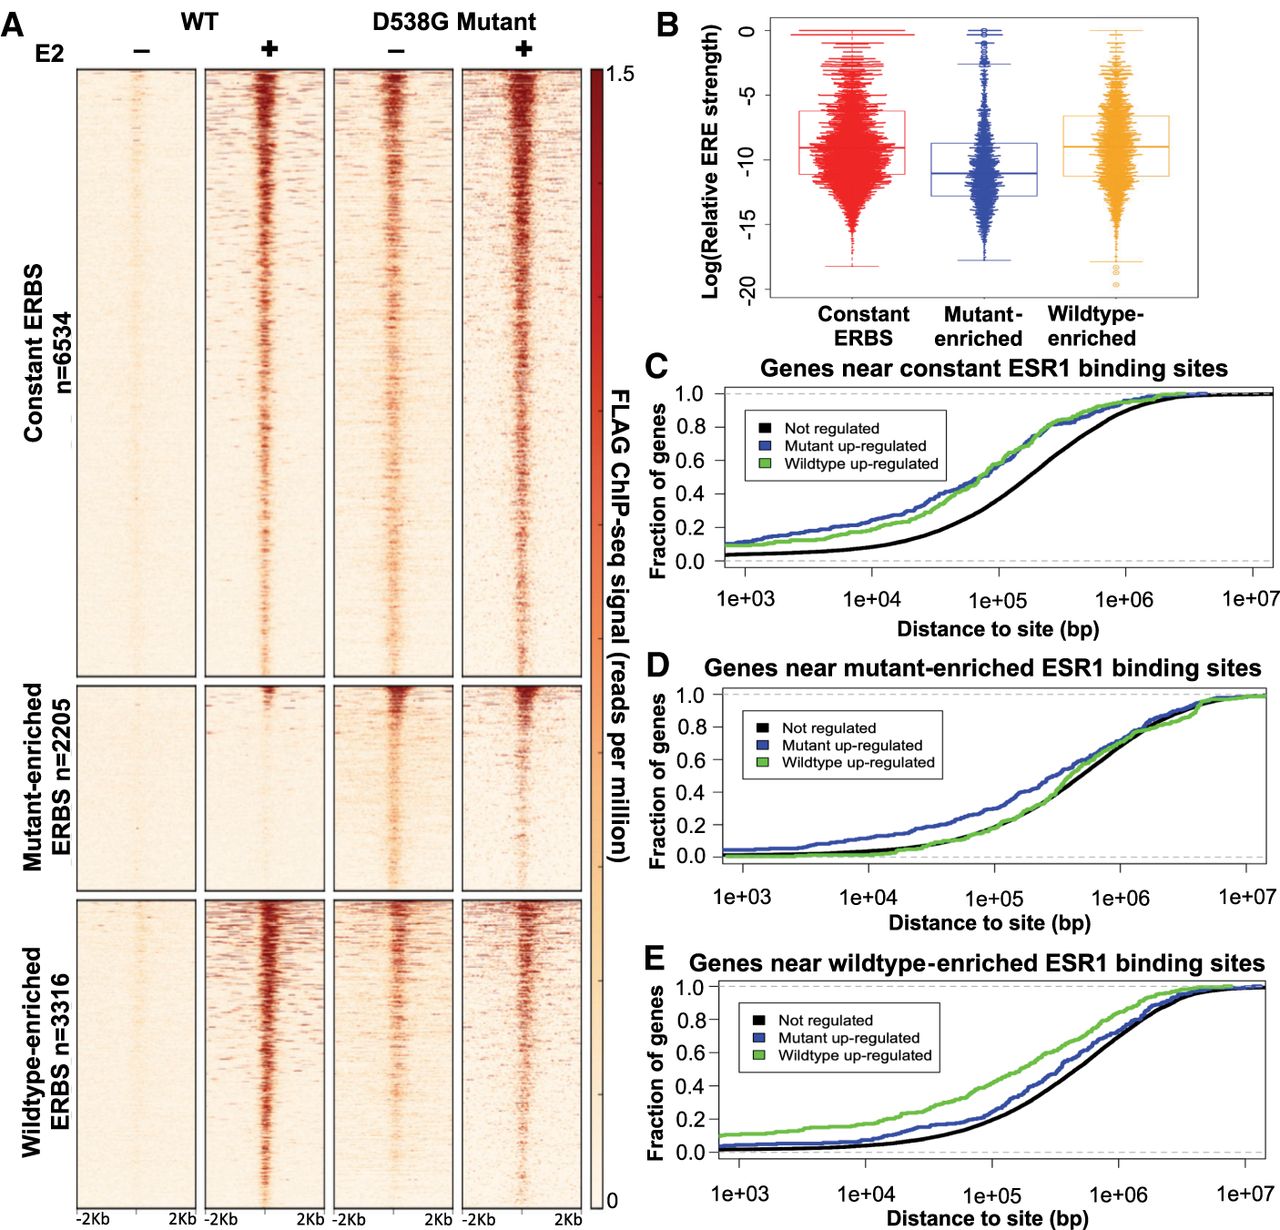
D538G mutation alters ESR1 genomic binding. (A) Heatmap displays ESR1 binding in representative wild-type and D538G mutant clones, in which each row is an ESR1 binding site. The heatmaps include sites that are constant in wild-type and mutant lines (top), sites that are enriched in the mutant lines (middle), and sites that are enriched in wild-type lines (bottom). (B) Plot shows that the distribution of the predicted relative affinity for ESR1, based on the best match to an ERE, is higher in constant binding sites (red) and wild-type–enriched sites (yellow) than D538G mutant-enriched ESR1 binding sites (blue). Cumulative distribution plots show the fraction of mutant up-regulated, down-regulated, or not regulated genes that have a constant (C), mutant-enriched (D), or wild-type–enriched (E) ESR1 binding site within a given distance from the transcription start site.


