
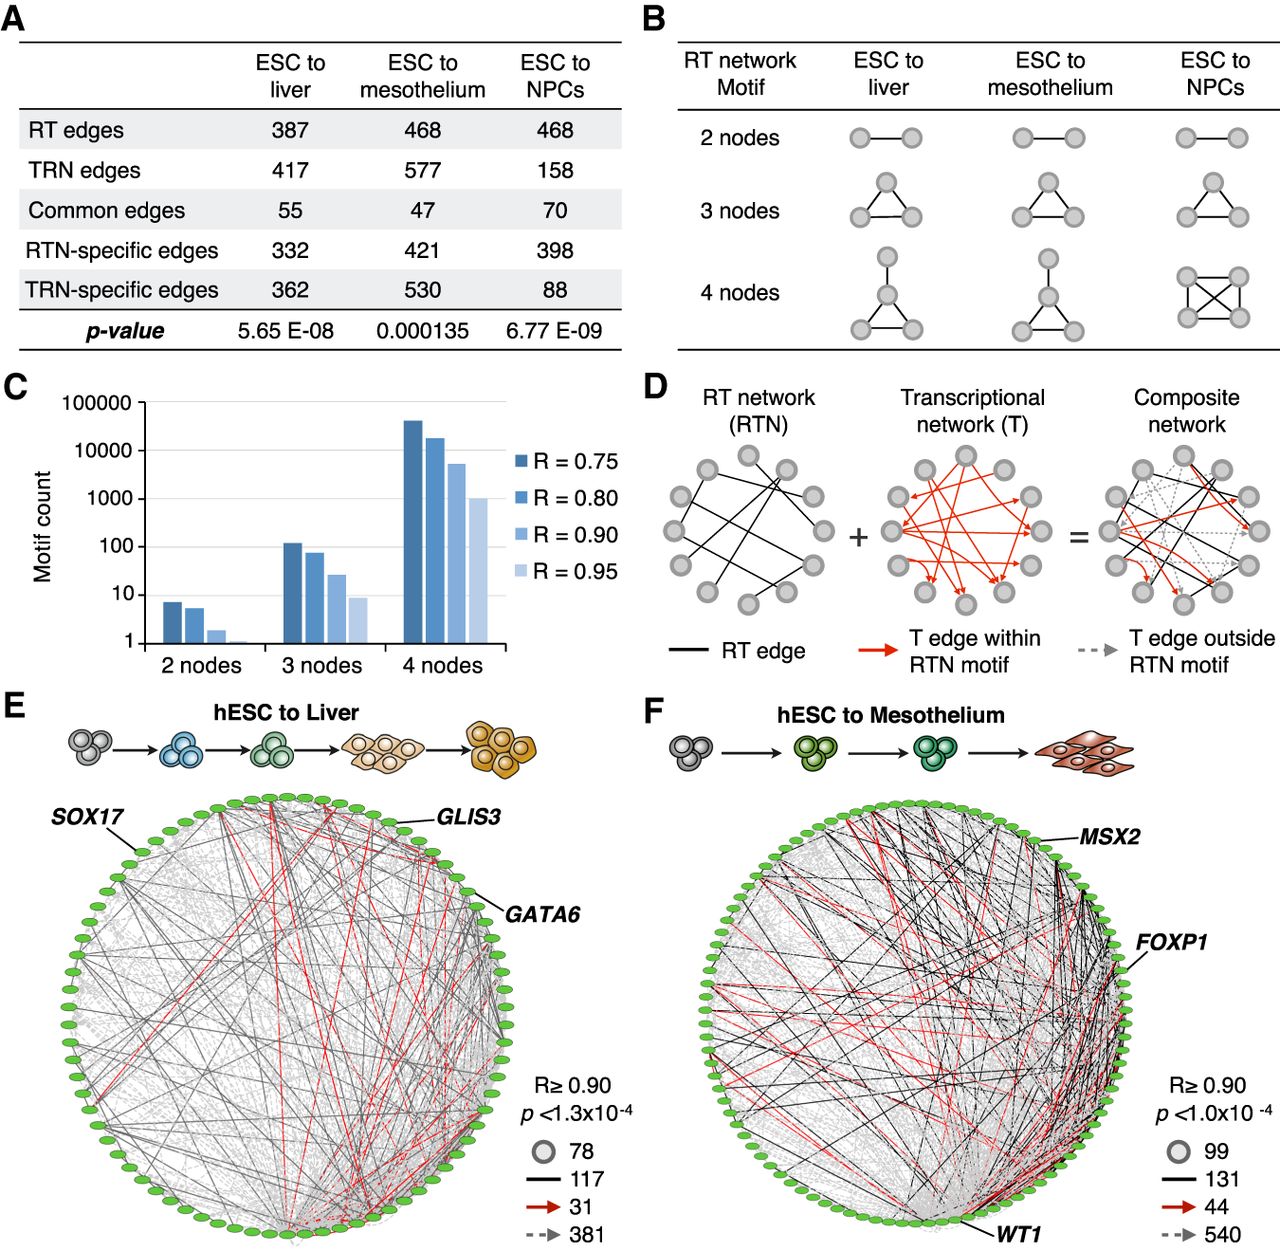
RT and transcriptional networks overlap and can be combined into composite networks. (A) Overlap analysis of RT and TRNs interaction edges. RT networks were constructed for matching cell types in the TRNs (Neph et al. 2012), and common and unique interaction edges were identified. Only genes within the TRNs were used (475 transcription factors), maintaining the filters for significant correlation and gene pairs in trans (separated by >500 kb or in distinct chromosomes). A hypergeometric test was performed to test the overlap significance (P-values are shown). (B,C) RT networks are enriched in motifs with multiple nodes. (B) The most enriched motif for each differentiation pathway is shown. (C) Motif frequency distribution at distinct thresholds in Pearson's correlation values (each bar represents a distinct correlation threshold –R). (D) Construction of composite networks by combining RT and transcriptional networks. RT networks were used to define the “base network,” which includes all nodes of RT-correlated genes; interaction edges between RT nodes were extracted from TRNs. Composite networks included all RT edges (black undirected lines), transcriptional edges within RT network motifs (directed solid red arrows), and transcriptional edges outside RT network motifs (directed dashed gray arrows). Exemplary composite networks for liver (E) and mesothelium differentiation (F) are shown. Pearson's correlation and Bonferroni's corrected P-values thresholds, as well as the number of nodes and edges, are shown.


