
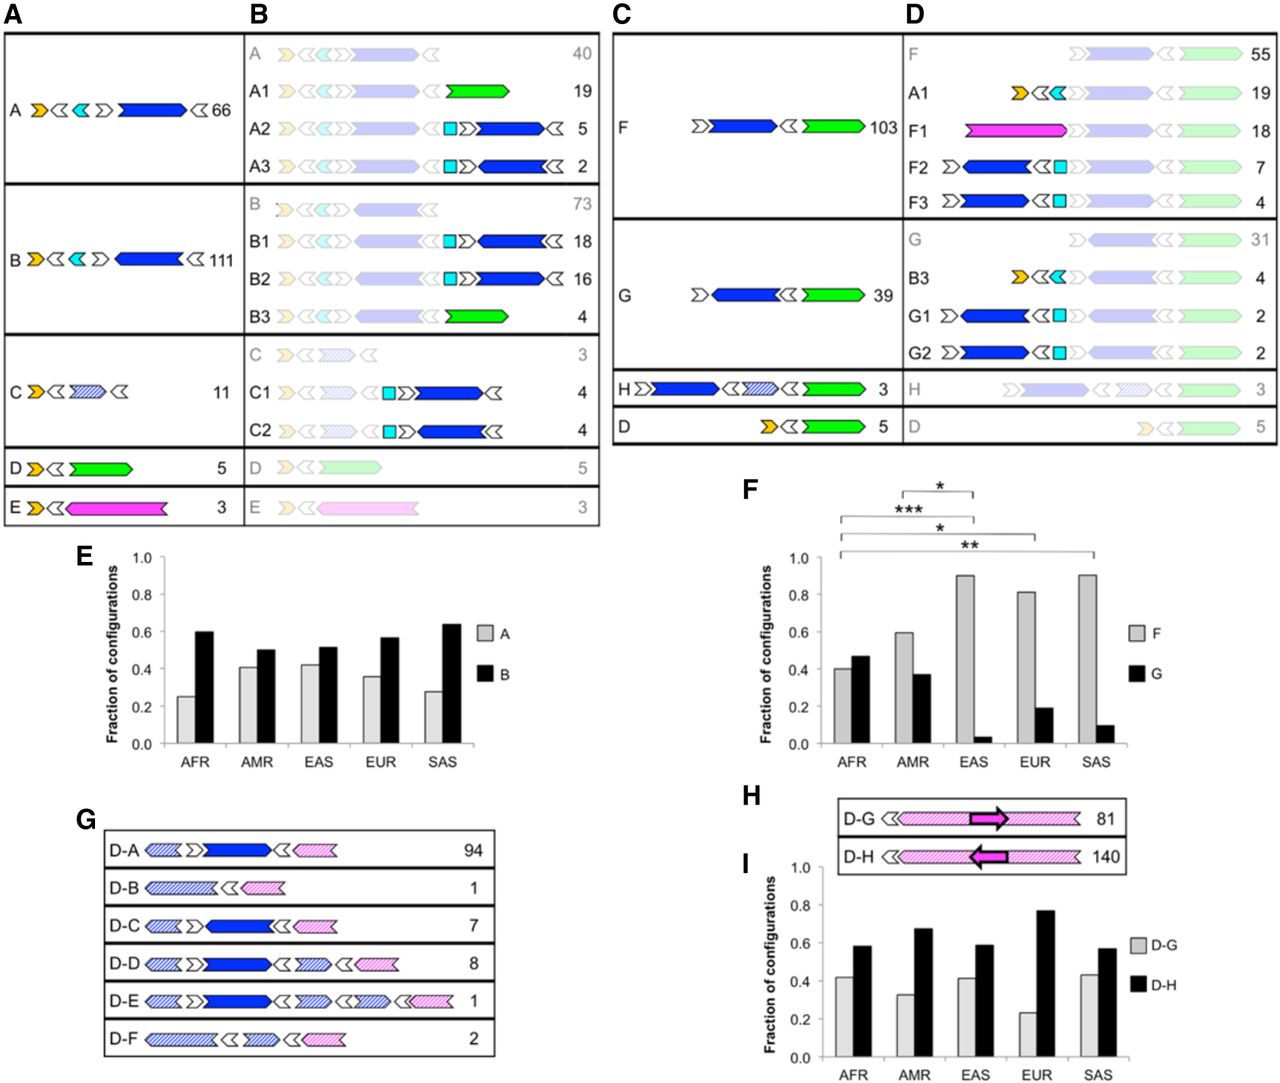
LCR22A and LCR22D configurations across a diverse control data set observed using Bionano optical mapping. Diagrams depict order and orientation of observed duplicons as defined in Figure 1. Minimal (A) and extended (B) configurations anchored in unique sequences upstream of LCR22A. Minimal (C) and extended (D) configurations anchored in unique sequence downstream from LCR22A. (E) Observed occurrences for upstream-anchored LCR22A configurations A and B in different populations. (F) Observed occurrences of downstream-anchored LCR22A configurations F and G in different populations. (G) Configurations anchored in unique sequence upstream of LCR22D. (H) Configurations anchored in unique sequence downstream from LCR22D. (I) Observed occurrences of downstream-anchored LCR22D configurations D–G and D–H in different populations. For each configuration in A–D and G–H, the ID is on the left, and the number of times that configuration was observed in the data set is on the right. Duplicons for which an orientation could not be determined are represented as squares. (AFR) African; (AMR) American; (EAS) East Asian; (EUR) European; (SAS) South Asian; (*) P < 0.05; (**) P < 0.01; (***) P < 0.001, Fisher's exact test, adjusted. Pairs of populations without asterisks in E, F, and I were not significantly different at P < 0.05.


