
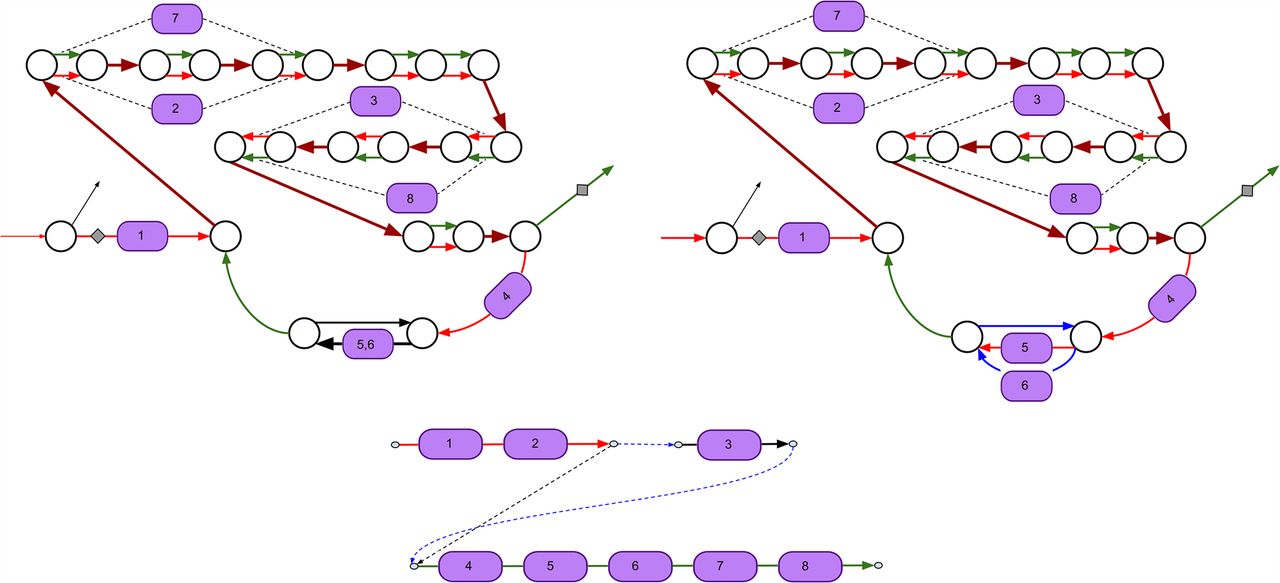
Subgraph of the assembly graph of Pseudomonas protegens Pf-5 corresponding to the pyoverdine NRP BGC. (Top left) The pyoverdine BGC is scattered over four scaffolds in the SPAdes assembly. Two scaffolds traversing single edges are shown by black color, and two scaffolds traversing multiple edges are shown by red and green colors. The repeat edges traversed by both red and green scaffolds are shown by brown color. Edges with low and high depth of coverage by reads are shown as thin and thick edges, respectively. Some A-domains span multiple edges (starting and ending positions of such domains are shown with dashed lines). (Top right) The domain restoration procedure restored two A-domains (5 and 6) in the assembly (SPAdes collapsed these domains into a single edge). Four scaffolds in the assembly graph are shown by red, green, blue, and black colors. (Bottom) The scaffolding graph of the pyoverdine BGC with a single rural postman route (dashed edges in this route are shown in blue).


