
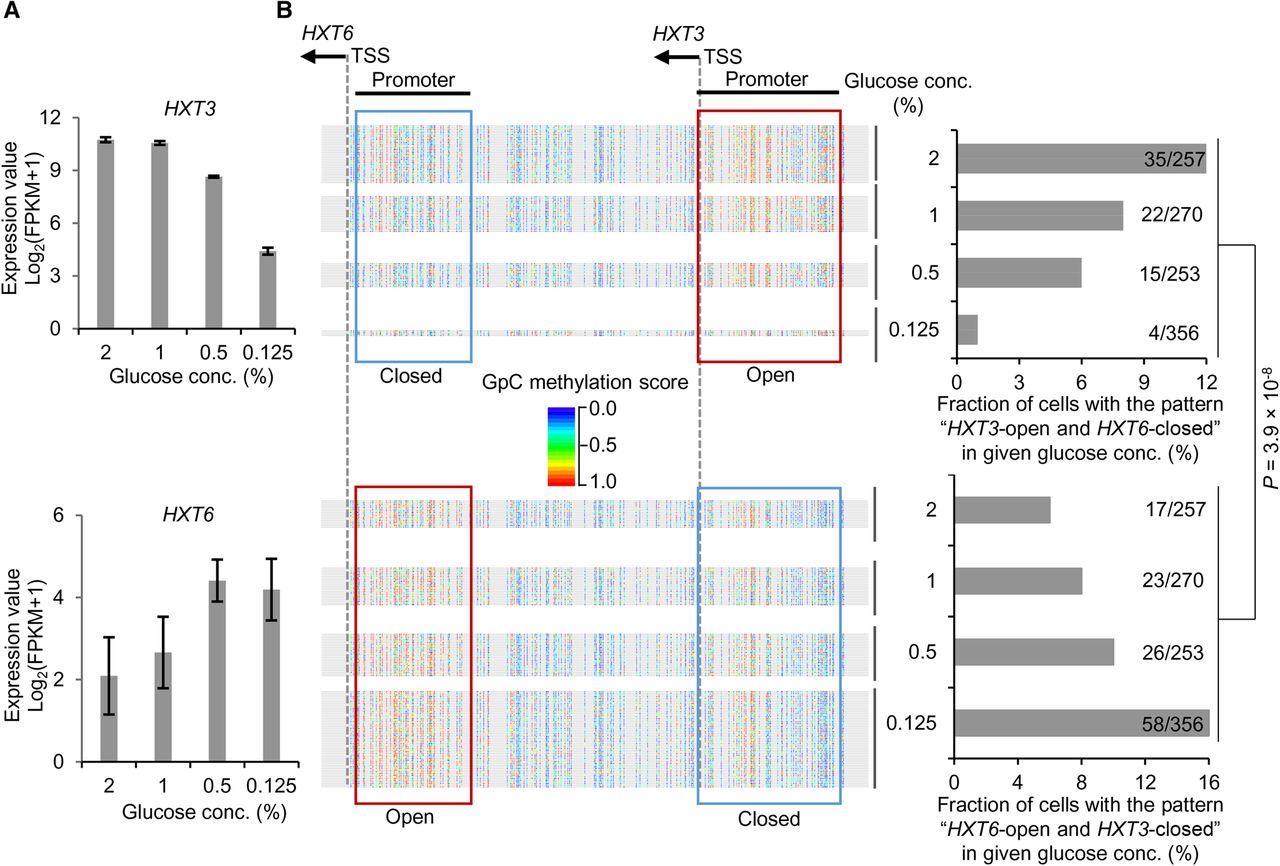
Relationship between chromatin accessibility and coexpression of HXT3 and HXT6. (A) Expression levels of HXT3 and HXT6 in response to glucose concentration change. FPKM from bulk-cell RNA-seq data was taken as the expression level. (B) Change of the coupled chromatin statuses of HXT3 and HXT6 in response to different glucose concentrations. Chromatin accessibility in promoters of HXT3 and HXT6 at the single-cell level is shown. Each line represents a molecule (i.e., cell). GpC site is labeled as a rainbow-color dot, with methylation score from 0 (blue) to 1.0 (red). A promoter was defined as “open” (highlighted by red box) if the methylation scores of the including GpC sites had a median value greater than 0.5, and “closed” (highlighted by blue box) otherwise. Cells are shown in four groups that corresponded to four glucose concentrations. The cell fractions are also shown on the bar charts. The P-value was calculated by a χ2 test under the null hypothesis that alternative openness status of the two genes was independent of glucose concentration.


