
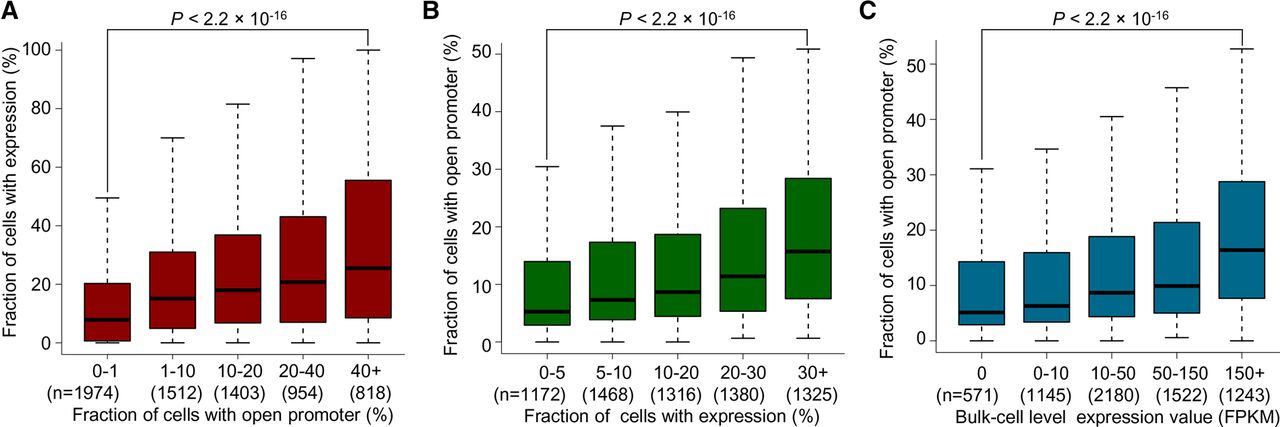
Quantitative relationship between chromatin accessibility and gene expression. (A,B) Quantitative relationship between chromatin accessibility and gene expression in a cell population. The former (A) was measured by the fraction of cells with an open promoter, and the latter (B) by the fraction of cells with expression (based on single-cell RNA-seq data). Genes were binned by one of the indices and the distribution of the other is shown. The gene was considered as “expressed” in a cell if the corresponding UMI (unique molecular identifier) count was ≥1. (C) Quantitative relationship between the bulk-cell gene expression and the cell population ratio of an open promoter. Genes were binned based on the bulk-cell gene expression level (RNA-seq data).


