
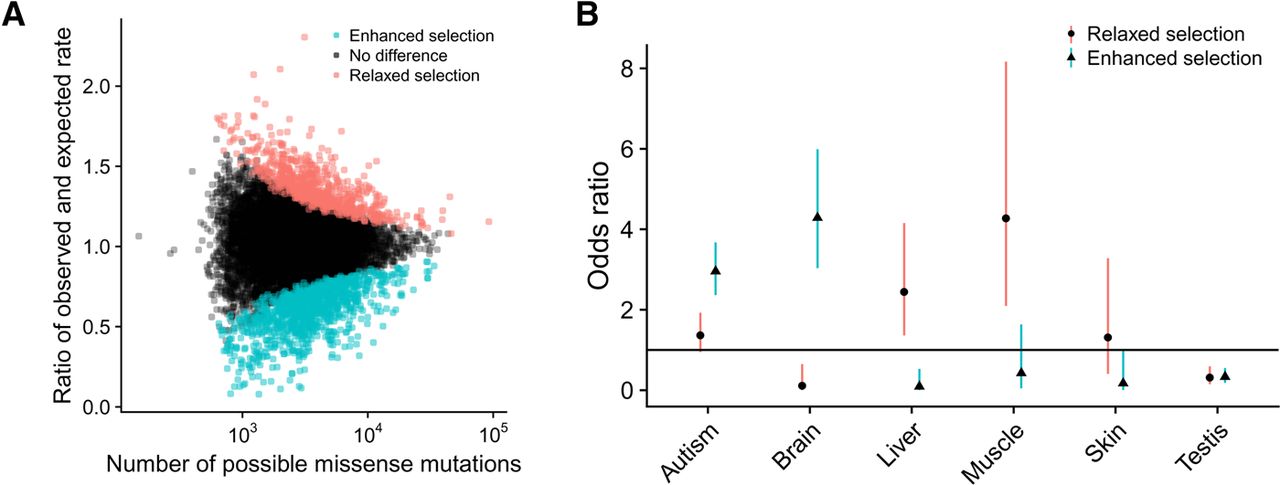
Genes under “enhanced” or “relaxed” selection relative to the exome-wide LASSIE model. (A) Number of potential missense mutations per gene (x-axis) versus fold-change of the observed number of rare missense mutations relative to the number expected under a Poisson-Binomial null model based on LASSIE (y-axis) (see Methods). Each dot represents a single protein-coding gene. Dots for genes showing significantly more rare variants than expected (“relaxed”; n = 773) are colored red, whereas those for genes showing significantly fewer rare variants than expected are colored blue (“enhanced”; n = 1118). (B) Groups of genes enriched for enhanced or relaxed selection. Dots represent odds ratios of enrichment, with bars indicating 95% confidence intervals. Genes under enhanced selection tend to be exclusively expressed in the central nervous system or associated with autism spectrum disorder. In contrast, genes under relaxed selection tend to be exclusively expressed in liver and skeletal muscle.


