
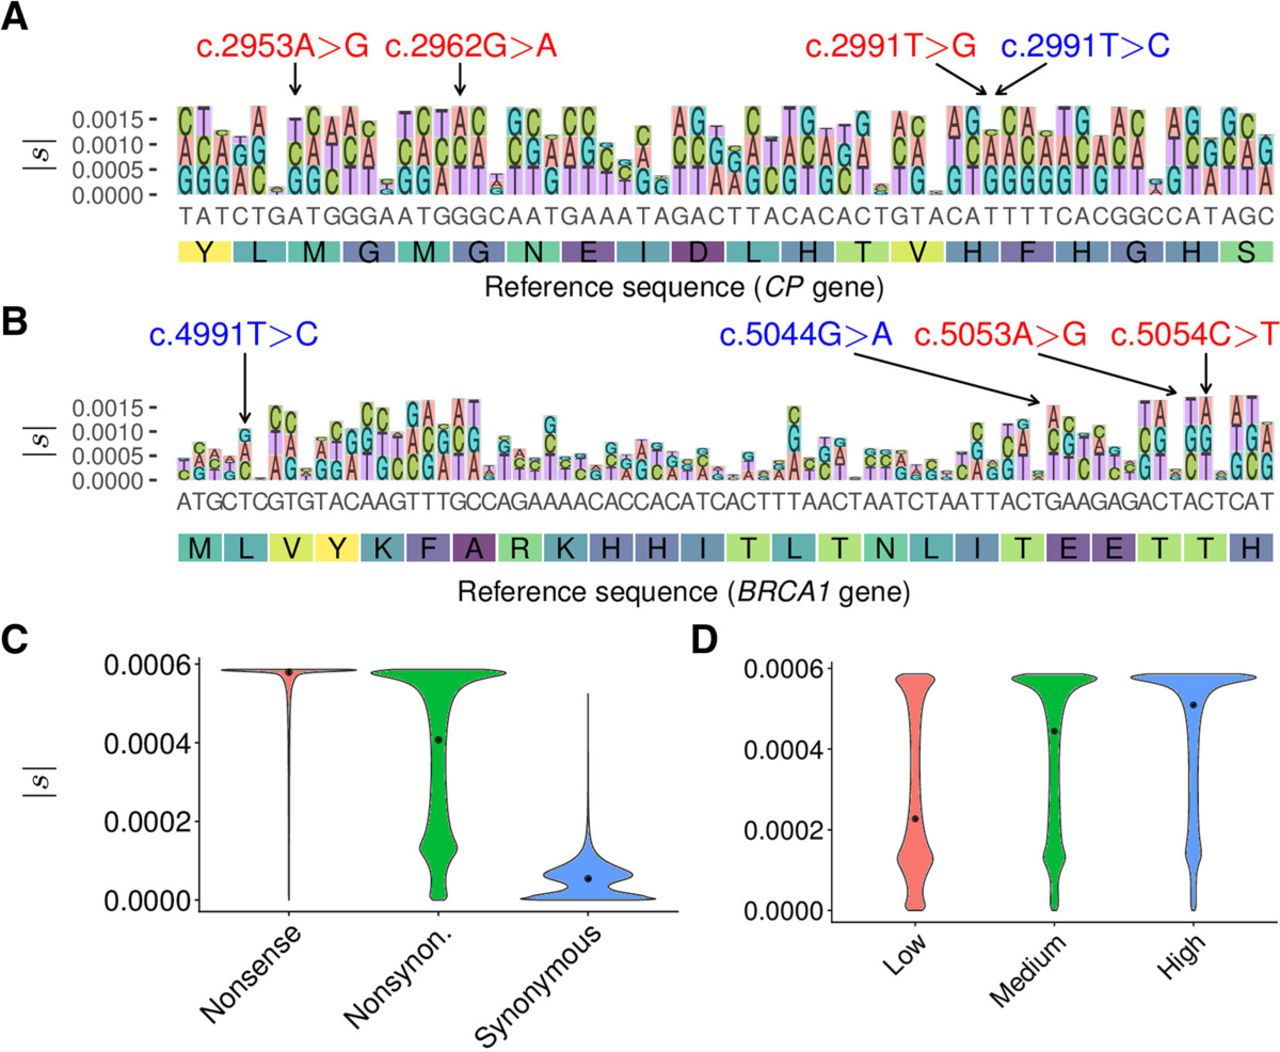
Distributions of selection coefficients estimated by LASSIE. (A) Variant-specific selection coefficients |s| estimated for all potential mutations in a 60-bp region in the CP gene. Nonreference alleles are distinguished by color and drawn with height proportional to |s|. The y-axis indicates cumulative |s|. The three nonsynonymous variants indicated at the top in red (c.2953A > G, c.2962G > A, and c.2991T > G) are associated with Mendelian diseases, and the synonymous variant indicated in blue (c.2991T > C) is benign. (B) Estimates of |s| for all potential mutations in a 72-bp region in the BRCA1 gene. The two nonsynonymous variants indicated at the top in red (c.5053A > G and c.5054C > T) are pathogenic, and the two nonsynonymous variants indicated in blue (c.4991T > C and c.5044G > A) are benign. (C) Distributions of estimated selection coefficients |s| for nonsense, nonsynonymous, and synonymous mutations. (D) Distributions of |s| for nonsynonymous mutations in genes expressed at low, medium, and high levels, based on tertiles of RNA-seq read counts from Roadmap Epigenomics data (Roadmap Epigenomics Consortium et al. 2015), showing a positive correlation between expression level and |s| (Spearman's rank correlation coefficient ρ = 0.338; P < 10−15, two-tailed t-test).


