
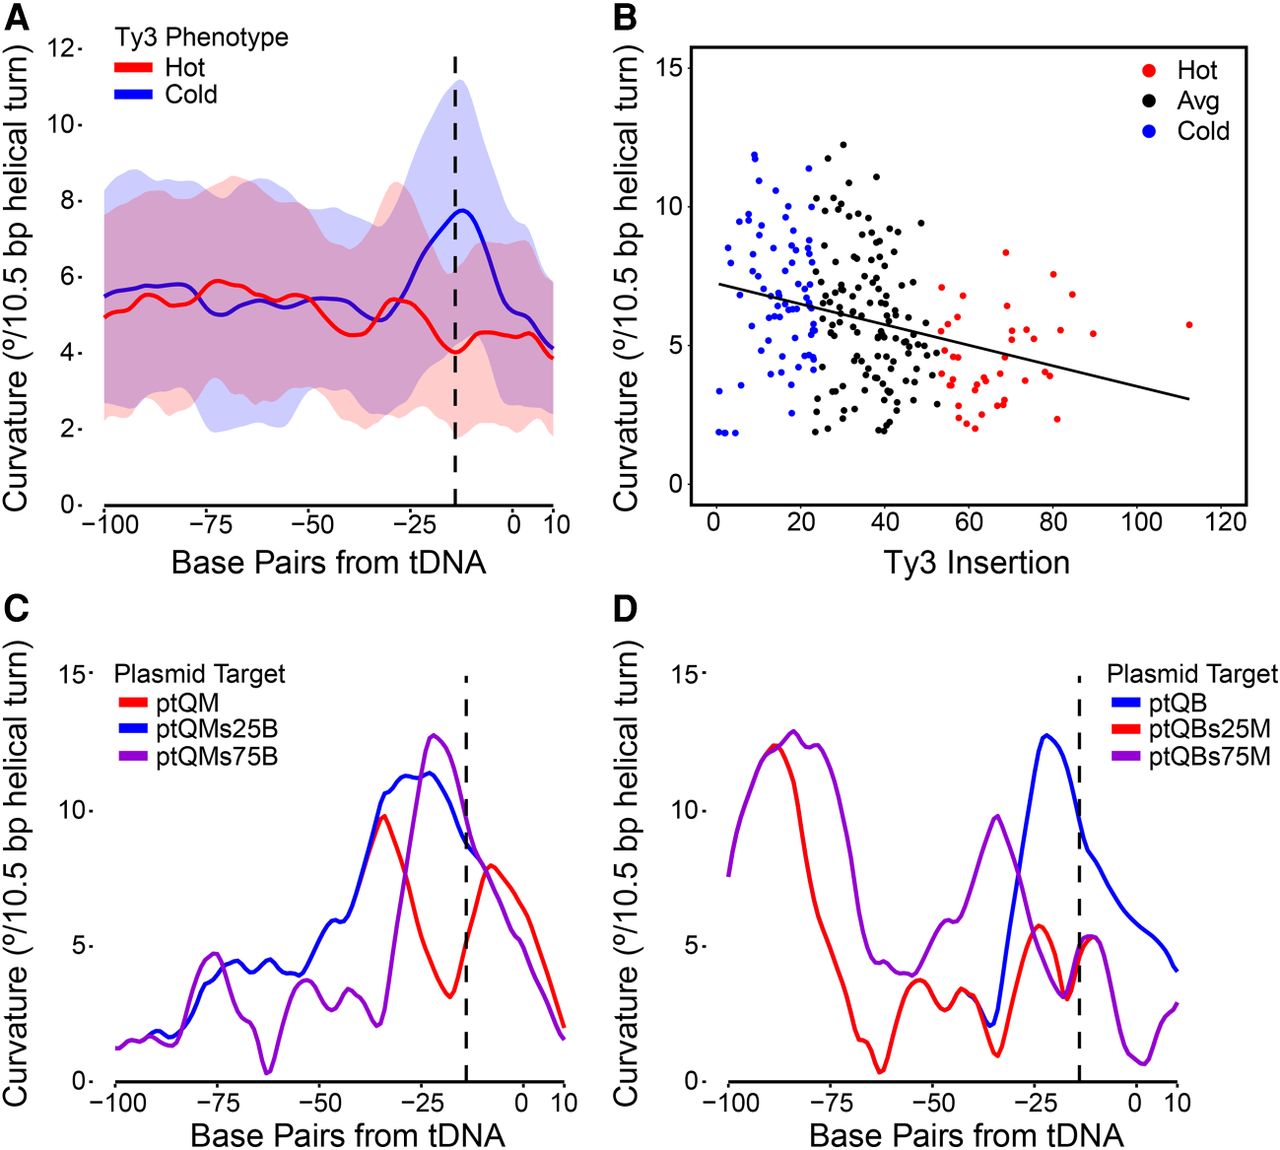
Figure 5.
Role of curvature in target site determination. (A) Plot of curvature as determined by bend.it analysis (Vlahovicek et al. 2003) of 100 bp upstream of tDNA for hot (tQM) and cold (tQB) targets. (B) Linear regression of curvature versus insertion frequency. (C,D) Plots of curvature of hot and cold plasmid targets and swapped sequences as described in legend of Figure 3C.


