
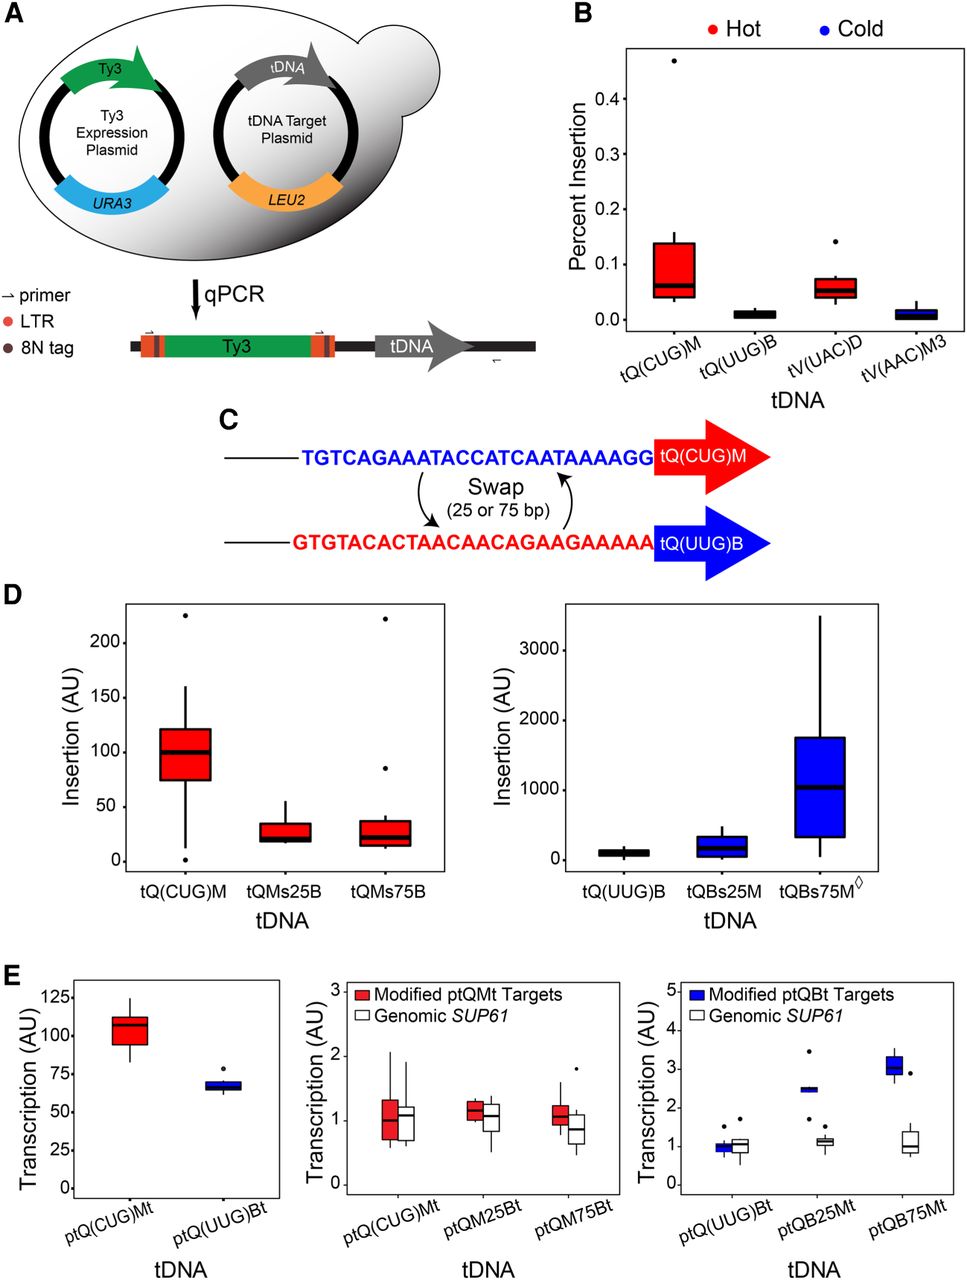
Ty3 insertion frequency into high-copy-number target plasmids. (A) Diagram of tDNA target assay. Measurement of insertion frequency of Ty3 into tDNA hot and cold target plasmids by qPCR described in Methods. (B) Frequency of insertion (%) into tDNA target plasmids. Biological replicates N = 4–6. (C) Diagram of hot tQ(CUG)M and cold tQ(UUG)B target tDNAs and sequence swaps. (D) Sequence upstream of tDNA mature coding region influences Ty3 insertion frequency. Measurement of insertion frequency into hot and cold tDNA targets with and without sequence swaps described in C. Insertion frequency expressed as arbitrary units (AU) normalized to native tDNA targets. Biological replicates N = 10–12. The diamond (◊) indicates a data point (14,124) excluded from the box plot. (E) Transcription levels from tDNA target plasmids. Box plots show transcription from tQM and tQB (left), or tQMt target plasmids with 25 or 75 bp of upstream sequence from tQBt (middle) and vice versa (right). White boxes represent transcription from genomic SUP61, an intron containing tRNA where nascent pre-tRNA was measured as a proxy for transcription. Values expressed as normalized arbitrary units (AU).


