
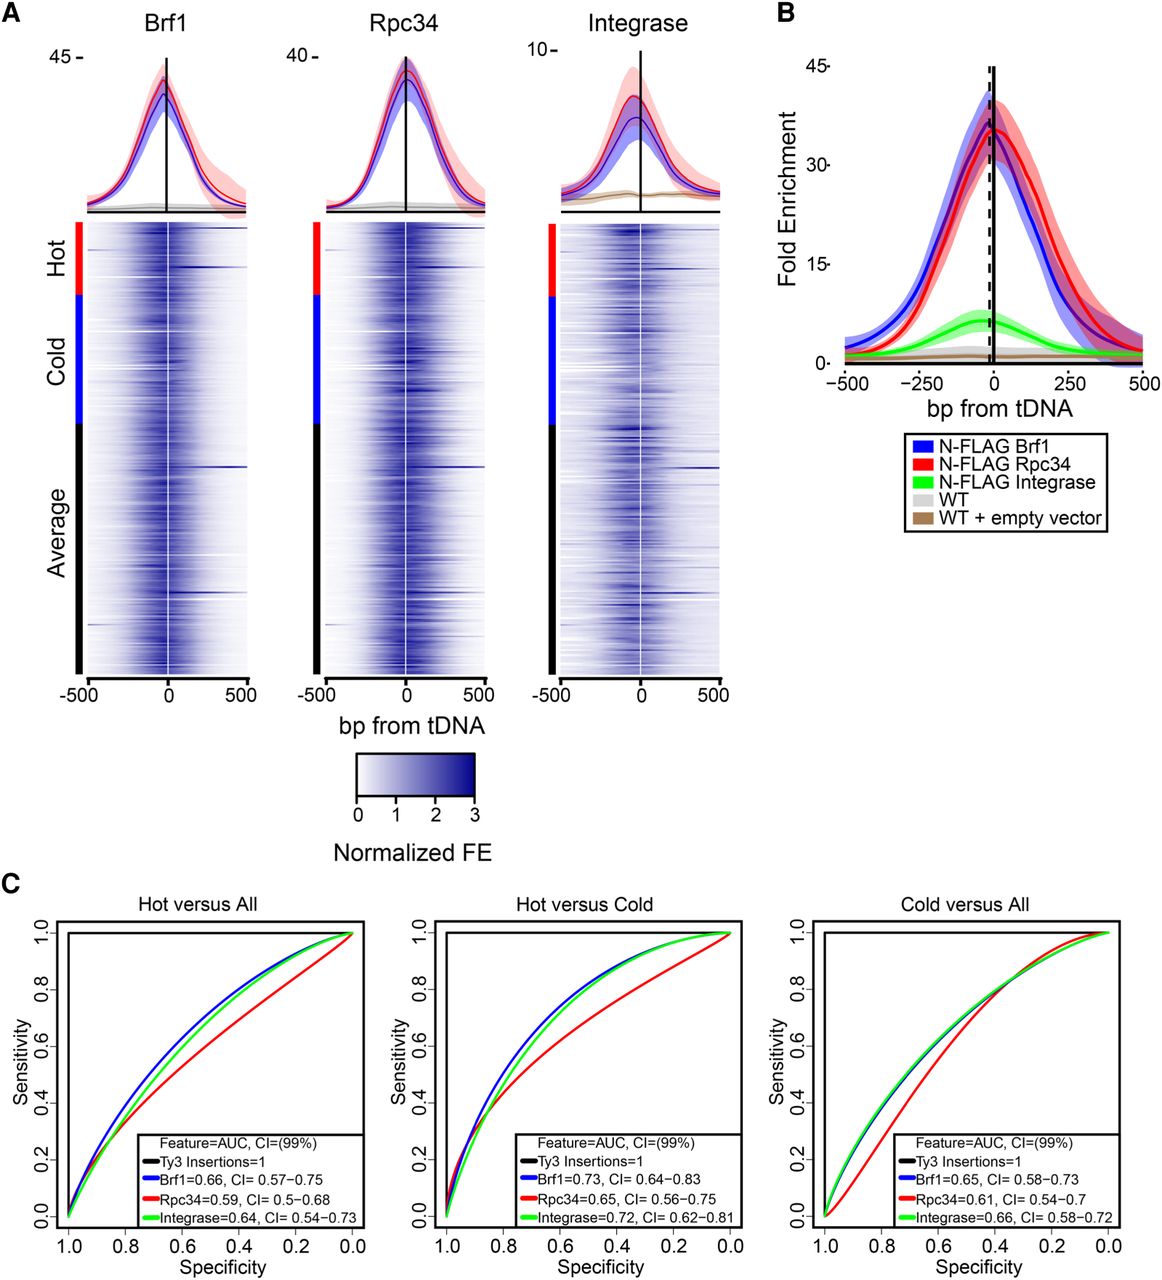
Basal transcription factors, RNAP3, and IN at Ty3 targets. (A) ChIP-seq analysis of N-FLAG-tagged Brf1, Rpc34, and IN. Heatmaps showing normalized fold enrichment (FE) for RNAP3-transcribed genes relative to flanking sequence; rows ordered according to Ty3 transposition frequency top to bottom, high to low, as indicated by the colored bar. Position 0 refers to the nucleotide encoding the 5′ end of the mature tRNA. Above the heatmaps is an expanded view of FE for Brf1, Rpc34, and IN for hot and cold genes compared to untagged Brf1 and Rpc34 strains and empty vector strain for IN with standard deviation represented in lower intensity. (B) Peak analysis averaged for all tDNAs and traced over a 1-kb surrounding window. Lightened haze around each line indicates standard deviation. WT refers to the untagged parent strain of N-FLAG Brf1 and N-FLAG Rpc34; WT + empty vector (pKP3915) control for N-FLAG IN (WT + pKP4010). The dotted vertical line represents the average Ty3 insertion site position. (C) ROC analysis comparing hot versus all other tDNA, hot versus cold, and cold versus all other tDNAs. Legends for each plot show the AUC with 99% confidence intervals (CI). As a positive control for each plot, Ty3 insertion frequency (used to define hot and cold) is included to show perfect association between phenotype classifier and FE predictors (black line).


